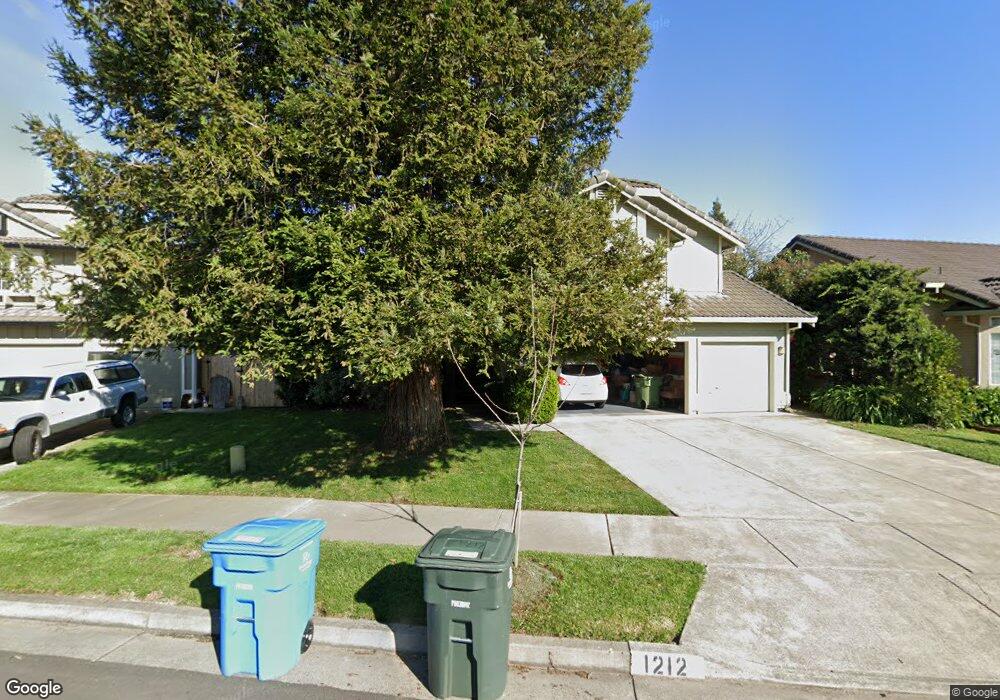
1212 De Meo St Santa Rosa, CA 95407
Estimated Value: $694,000 - $742,000
4
Beds
3
Baths
1,901
Sq Ft
$378/Sq Ft
Est. Value
About This Home
This home is located at 1212 De Meo St, Santa Rosa, CA 95407 and is currently estimated at $718,030, approximately $377 per square foot. 1212 De Meo St is a home located in Sonoma County with nearby schools including Elsie Allen High School and St. Michael's Orthodox School.
Ownership History
Date
Name
Owned For
Owner Type
Purchase Details
Closed on
Jan 9, 2006
Sold by
Ortega Felipe
Bought by
Ortega Felipe and Cervantes Maria
Current Estimated Value
Home Financials for this Owner
Home Financials are based on the most recent Mortgage that was taken out on this home.
Original Mortgage
$412,500
Outstanding Balance
$224,661
Interest Rate
5.75%
Mortgage Type
New Conventional
Estimated Equity
$493,369
Purchase Details
Closed on
Oct 9, 2002
Sold by
Rm Stonypoint Investments Lp
Bought by
Ortega Felipe
Home Financials for this Owner
Home Financials are based on the most recent Mortgage that was taken out on this home.
Original Mortgage
$309,500
Interest Rate
4.87%
Purchase Details
Closed on
May 1, 2002
Sold by
Kawamoto Genshiro
Bought by
Rm Stonypoint Investments Lp
Home Financials for this Owner
Home Financials are based on the most recent Mortgage that was taken out on this home.
Original Mortgage
$31,529,140
Interest Rate
7.13%
Mortgage Type
Construction
Create a Home Valuation Report for This Property
The Home Valuation Report is an in-depth analysis detailing your home's value as well as a comparison with similar homes in the area
Home Values in the Area
Average Home Value in this Area
Purchase History
| Date | Buyer | Sale Price | Title Company |
|---|---|---|---|
| Ortega Felipe | -- | Fidelity Natl Title Co | |
| Ortega Felipe | $387,000 | North Bay Title Co | |
| Rm Stonypoint Investments Lp | -- | North Bay Title Co |
Source: Public Records
Mortgage History
| Date | Status | Borrower | Loan Amount |
|---|---|---|---|
| Open | Ortega Felipe | $412,500 | |
| Previous Owner | Ortega Felipe | $309,500 | |
| Previous Owner | Rm Stonypoint Investments Lp | $31,529,140 | |
| Closed | Ortega Felipe | $77,350 |
Source: Public Records
Tax History Compared to Growth
Tax History
| Year | Tax Paid | Tax Assessment Tax Assessment Total Assessment is a certain percentage of the fair market value that is determined by local assessors to be the total taxable value of land and additions on the property. | Land | Improvement |
|---|---|---|---|---|
| 2025 | $6,234 | $560,354 | $152,070 | $408,284 |
| 2024 | $6,234 | $549,368 | $149,089 | $400,279 |
| 2023 | $6,234 | $538,597 | $146,166 | $392,431 |
| 2022 | $5,879 | $528,037 | $143,300 | $384,737 |
| 2021 | $5,803 | $517,685 | $140,491 | $377,194 |
| 2020 | $5,650 | $512,378 | $139,051 | $373,327 |
| 2019 | $5,580 | $502,332 | $136,325 | $366,007 |
| 2018 | $5,530 | $492,483 | $133,652 | $358,831 |
| 2017 | $5,411 | $482,828 | $131,032 | $351,796 |
| 2016 | $5,371 | $473,362 | $128,463 | $344,899 |
| 2015 | $5,088 | $456,000 | $124,000 | $332,000 |
| 2014 | $4,164 | $383,000 | $104,000 | $279,000 |
Source: Public Records
Map
Nearby Homes
- 1521 Hughes Ave
- 2002 Marble St
- 2006 Lazzini Ave
- 1953 Alamo Ln
- 1461 Trombetta St
- 2542 Buss Dr
- 0 West Ave Unit 325019616
- 2488 Giffen Ave
- 733 Leo Dr
- 59 Roundelay Ln
- 62 Romani Ct
- 70 Romani Ct
- 534 E Jasmine Cir
- 628 Wisteria Ln
- 1630 Mathwig Dr
- 576 E Jasmine Cir
- 1538 Surrey Dr
- 751 W Jasmine Cir Unit 3
- 2778 Coleman Glen Ln
- 1260 Aloise Ave
- 1216 De Meo St
- 1208 De Meo St
- 1217 Comalli St
- 1213 Comalli St
- 1220 De Meo St
- 1204 De Meo St
- 1221 Comalli St
- 1209 Comalli St
- 1211 De Meo St
- 1207 De Meo St
- 1215 De Meo St
- 1224 De Meo St
- 1225 Comalli St
- 1200 De Meo St
- 1205 Comalli St
- 1219 De Meo St
- 1203 De Meo St
- 1223 De Meo St
- 1206 Trombetta St
- 1229 Comalli St