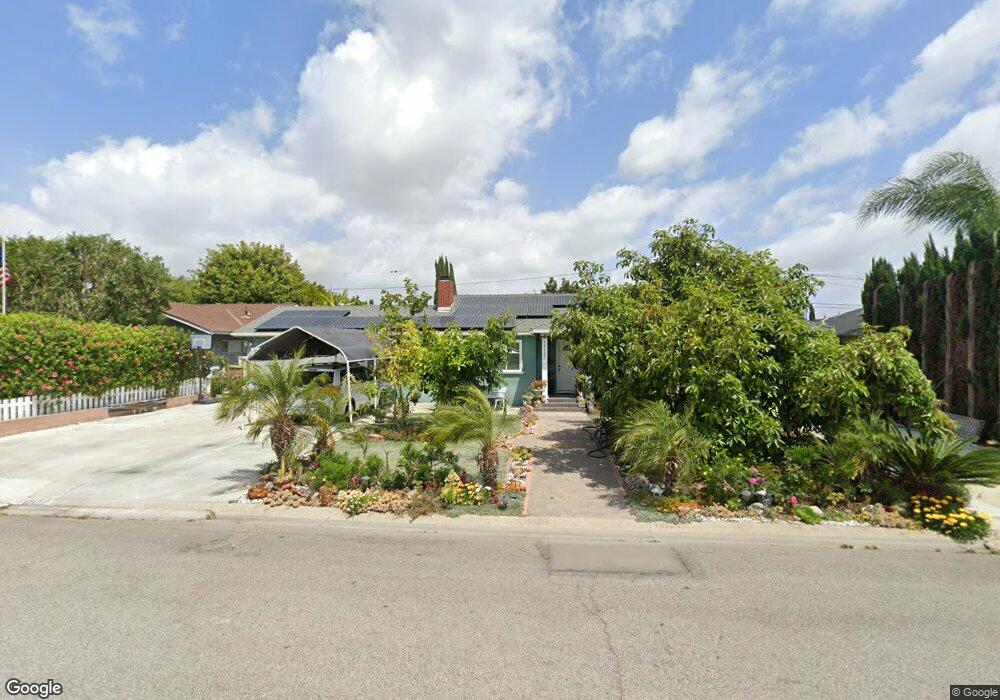
12122 Burns Dr Garden Grove, CA 92840
Estimated Value: $1,054,000 - $1,081,000
3
Beds
2
Baths
1,502
Sq Ft
$709/Sq Ft
Est. Value
About This Home
This home is located at 12122 Burns Dr, Garden Grove, CA 92840 and is currently estimated at $1,064,686, approximately $708 per square foot. 12122 Burns Dr is a home located in Orange County with nearby schools including Stanley Elementary School, Garden Grove High School, and St. Columban School.
Ownership History
Date
Name
Owned For
Owner Type
Purchase Details
Closed on
Apr 9, 2016
Sold by
Nguyen Groyz and Nguyen Tina
Bought by
The Groyz Phuong Nguyen & Tina Tran Nguy
Current Estimated Value
Purchase Details
Closed on
Mar 19, 2003
Sold by
Ennis John P and Ennis Cheryl
Bought by
Nguyen Groyz and Nguyen Tina
Home Financials for this Owner
Home Financials are based on the most recent Mortgage that was taken out on this home.
Original Mortgage
$322,700
Outstanding Balance
$135,280
Interest Rate
5.54%
Estimated Equity
$929,406
Purchase Details
Closed on
Oct 16, 2002
Sold by
Rosenow Carolyn E
Bought by
Ennis John P and Ennis Cheryl
Home Financials for this Owner
Home Financials are based on the most recent Mortgage that was taken out on this home.
Original Mortgage
$310,500
Interest Rate
8.99%
Create a Home Valuation Report for This Property
The Home Valuation Report is an in-depth analysis detailing your home's value as well as a comparison with similar homes in the area
Home Values in the Area
Average Home Value in this Area
Purchase History
| Date | Buyer | Sale Price | Title Company |
|---|---|---|---|
| The Groyz Phuong Nguyen & Tina Tran Nguy | -- | None Available | |
| Nguyen Groyz | $410,000 | First American Title Co | |
| Ennis John P | $345,000 | Lawyers Title Company |
Source: Public Records
Mortgage History
| Date | Status | Borrower | Loan Amount |
|---|---|---|---|
| Open | Nguyen Groyz | $322,700 | |
| Previous Owner | Ennis John P | $310,500 |
Source: Public Records
Tax History Compared to Growth
Tax History
| Year | Tax Paid | Tax Assessment Tax Assessment Total Assessment is a certain percentage of the fair market value that is determined by local assessors to be the total taxable value of land and additions on the property. | Land | Improvement |
|---|---|---|---|---|
| 2025 | $7,906 | $647,249 | $503,717 | $143,532 |
| 2024 | $7,906 | $634,558 | $493,840 | $140,718 |
| 2023 | $7,762 | $622,116 | $484,157 | $137,959 |
| 2022 | $7,589 | $609,918 | $474,664 | $135,254 |
| 2021 | $7,482 | $597,959 | $465,357 | $132,602 |
| 2020 | $7,391 | $591,828 | $460,585 | $131,243 |
| 2019 | $7,288 | $580,224 | $451,554 | $128,670 |
| 2018 | $7,106 | $568,848 | $442,700 | $126,148 |
| 2017 | $7,032 | $557,695 | $434,020 | $123,675 |
| 2016 | $6,690 | $546,760 | $425,510 | $121,250 |
| 2015 | $6,668 | $538,548 | $419,119 | $119,429 |
| 2014 | $5,338 | $427,200 | $317,921 | $109,279 |
Source: Public Records
Map
Nearby Homes
- 11252 Chapman Ave
- 11102 Avolencia Place
- 11081 Iris Dr
- 12332 Euclid St
- 12256 Lesley St
- 11731 Rose Dr
- 405 13181 Lampson
- 2227 S Atlanta St
- 10882 Chapman Ave
- 11841 Shetland Rd
- 12677 8th St
- 11052 Peppertree Ln
- 12071 Diane St
- 12600 Euclid St Unit 19
- 11552 9th St
- 12555 S Euclid St Unit 32
- 12555 Euclid St Unit 79
- 12555 Euclid St Unit 61
- 12662 Woodland Ln
- 12851 Newhope St