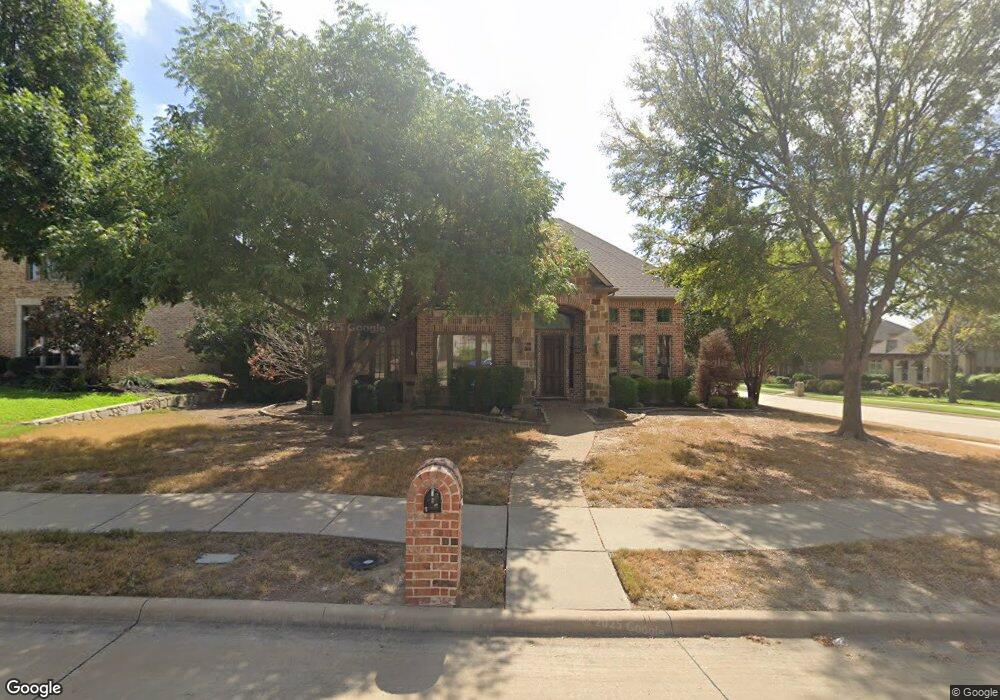
12122 Flynt Dr Frisco, TX 75035
East Frisco NeighborhoodEstimated Value: $749,000 - $777,000
4
Beds
4
Baths
3,817
Sq Ft
$202/Sq Ft
Est. Value
About This Home
This home is located at 12122 Flynt Dr, Frisco, TX 75035 and is currently estimated at $769,666, approximately $201 per square foot. 12122 Flynt Dr is a home located in Collin County with nearby schools including Tadlock Elementary School, Libby Cash Maus Middle School, and Memorial High School.
Ownership History
Date
Name
Owned For
Owner Type
Purchase Details
Closed on
Jul 15, 2016
Sold by
Featherstone Matthew J
Bought by
Jeffcoats Mark
Current Estimated Value
Home Financials for this Owner
Home Financials are based on the most recent Mortgage that was taken out on this home.
Original Mortgage
$410,000
Outstanding Balance
$328,145
Interest Rate
3.66%
Mortgage Type
New Conventional
Estimated Equity
$441,521
Purchase Details
Closed on
Dec 11, 2009
Sold by
Phelan Kevin D and Phelan Laura
Bought by
Featherstone Matthew J
Home Financials for this Owner
Home Financials are based on the most recent Mortgage that was taken out on this home.
Original Mortgage
$283,200
Interest Rate
5.06%
Mortgage Type
New Conventional
Purchase Details
Closed on
Mar 15, 2005
Sold by
Darling Homes Of Dallas Ltd
Bought by
Phelan Kevin D and Phelan Laura
Home Financials for this Owner
Home Financials are based on the most recent Mortgage that was taken out on this home.
Original Mortgage
$293,450
Interest Rate
5.67%
Mortgage Type
Purchase Money Mortgage
Create a Home Valuation Report for This Property
The Home Valuation Report is an in-depth analysis detailing your home's value as well as a comparison with similar homes in the area
Home Values in the Area
Average Home Value in this Area
Purchase History
| Date | Buyer | Sale Price | Title Company |
|---|---|---|---|
| Jeffcoats Mark | -- | Republic Title Of Texas | |
| Featherstone Matthew J | -- | Rtt | |
| Phelan Kevin D | -- | -- |
Source: Public Records
Mortgage History
| Date | Status | Borrower | Loan Amount |
|---|---|---|---|
| Open | Jeffcoats Mark | $410,000 | |
| Previous Owner | Featherstone Matthew J | $283,200 | |
| Previous Owner | Phelan Kevin D | $293,450 | |
| Closed | Phelan Kevin D | $55,024 |
Source: Public Records
Tax History Compared to Growth
Tax History
| Year | Tax Paid | Tax Assessment Tax Assessment Total Assessment is a certain percentage of the fair market value that is determined by local assessors to be the total taxable value of land and additions on the property. | Land | Improvement |
|---|---|---|---|---|
| 2025 | $11,297 | $764,401 | $178,500 | $585,901 |
| 2024 | $11,297 | $773,140 | $178,500 | $594,640 |
| 2023 | $11,297 | $752,565 | $178,500 | $592,362 |
| 2022 | $12,952 | $684,150 | $147,000 | $537,150 |
| 2021 | $9,487 | $483,257 | $105,000 | $378,257 |
| 2020 | $9,132 | $447,413 | $105,000 | $342,413 |
| 2019 | $10,000 | $465,423 | $105,000 | $360,423 |
| 2018 | $10,172 | $466,885 | $105,000 | $361,885 |
| 2017 | $9,990 | $458,551 | $105,000 | $353,551 |
| 2016 | $9,564 | $434,803 | $99,750 | $335,053 |
| 2015 | $7,849 | $423,679 | $89,250 | $334,429 |
Source: Public Records
Map
Nearby Homes
- 12092 Ashaway Ln
- 11974 Verona Ct
- 10092 Plainsman Ln
- 10185 Burnt Mill Ln
- 10138 Drawbridge Dr
- 12142 Lazio Ln
- 10620 Bancroft Ln
- 10670 Astoria Dr
- 9849 Vickie Ln
- 10644 Bartlett Dr
- 10754 Toffenham Dr
- 12342 Salem Dr
- 12928 Sewanee Dr
- 13121 Lanier Dr
- 10556 Midway Dr
- 13345 Anita Ct
- 10906 Ascot Dr
- 11344 Corsicana Dr
- 13647 Monstrell Rd
- 11310 Seguin Dr
- 12146 Flynt Dr
- 2324 Clancy Dr
- 12168 Flynt Dr
- 12011 Bamberg Ln
- 9847 Clancy Dr
- 12035 Bamberg Ln
- 9829 Clancy Dr
- 12133 Flynt Dr
- 9865 Clancy Dr
- 12159 Flynt Dr
- 12111 Flynt Dr
- 12059 Bamberg Ln
- 9811 Clancy Dr
- 9883 Clancy Dr
- 12181 Flynt Dr
- 12194 Flynt Dr
- 12083 Bamberg Ln
- 12216 Ashaway Ln
- 12012 Bamberg Ln
- 11955 Bamberg Ln