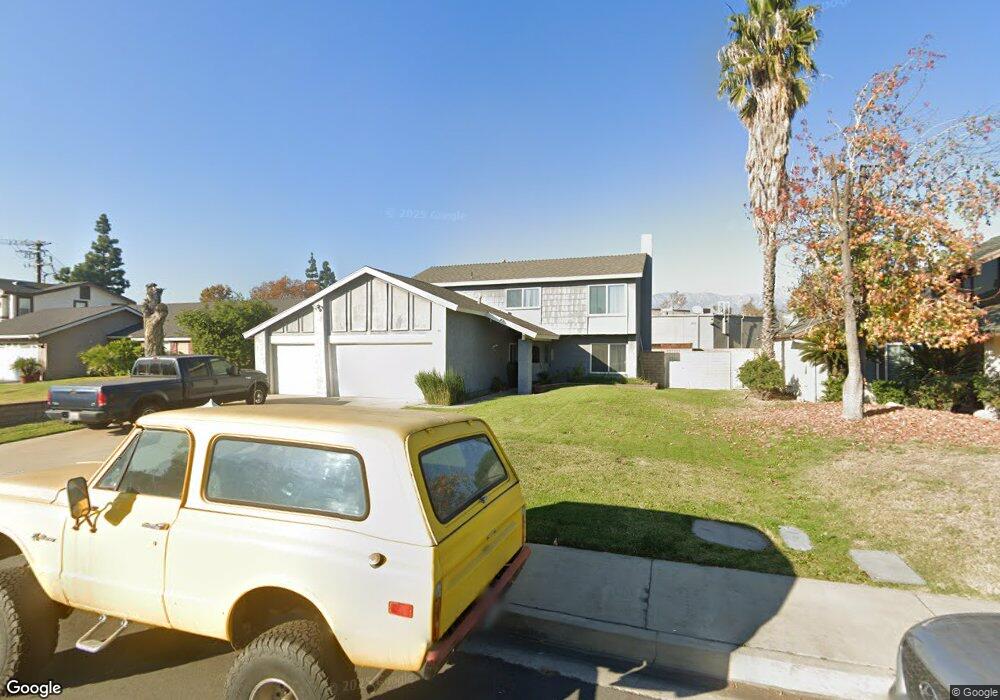
1213 E Oak Hill Dr Ontario, CA 91761
Ontario Ranch NeighborhoodEstimated Value: $739,000 - $790,000
4
Beds
3
Baths
1,734
Sq Ft
$443/Sq Ft
Est. Value
About This Home
This home is located at 1213 E Oak Hill Dr, Ontario, CA 91761 and is currently estimated at $767,446, approximately $442 per square foot. 1213 E Oak Hill Dr is a home located in San Bernardino County with nearby schools including Bon View Elementary, De Anza Middle, and Colony High.
Ownership History
Date
Name
Owned For
Owner Type
Purchase Details
Closed on
Jul 29, 2011
Sold by
Lund Robert A and Lund Jeniffer Y
Bought by
Lund Robert A and Lund Jeniffer Y
Current Estimated Value
Purchase Details
Closed on
May 19, 2005
Sold by
Yu Jeniffer M
Bought by
Lund Robert Allen and Lund Jeniffer Yu
Purchase Details
Closed on
May 16, 2003
Sold by
Bogenschild Norman and Bogenschild Karen
Bought by
Yu Jeniffer M
Home Financials for this Owner
Home Financials are based on the most recent Mortgage that was taken out on this home.
Original Mortgage
$256,500
Interest Rate
5.26%
Mortgage Type
Purchase Money Mortgage
Purchase Details
Closed on
Feb 7, 2002
Sold by
Bogenschild Norman and Bogenschild Karen
Bought by
Bogenschild Norman and Bogenschild Karen
Home Financials for this Owner
Home Financials are based on the most recent Mortgage that was taken out on this home.
Original Mortgage
$70,800
Interest Rate
7.04%
Mortgage Type
Stand Alone Second
Purchase Details
Closed on
Mar 18, 1999
Sold by
Anderson Donald W and Anderson Shirley
Bought by
Bogenschild Norman and Haldeman Karen
Home Financials for this Owner
Home Financials are based on the most recent Mortgage that was taken out on this home.
Original Mortgage
$131,100
Interest Rate
7.04%
Create a Home Valuation Report for This Property
The Home Valuation Report is an in-depth analysis detailing your home's value as well as a comparison with similar homes in the area
Home Values in the Area
Average Home Value in this Area
Purchase History
| Date | Buyer | Sale Price | Title Company |
|---|---|---|---|
| Lund Robert A | -- | None Available | |
| Lund Robert Allen | -- | -- | |
| Yu Jeniffer M | $270,000 | First American | |
| Bogenschild Norman | -- | Southland Title | |
| Bogenschild Norman | $164,000 | Northern Counties Title |
Source: Public Records
Mortgage History
| Date | Status | Borrower | Loan Amount |
|---|---|---|---|
| Previous Owner | Yu Jeniffer M | $256,500 | |
| Previous Owner | Bogenschild Norman | $70,800 | |
| Previous Owner | Bogenschild Norman | $131,100 | |
| Closed | Bogenschild Norman | $32,800 |
Source: Public Records
Tax History Compared to Growth
Tax History
| Year | Tax Paid | Tax Assessment Tax Assessment Total Assessment is a certain percentage of the fair market value that is determined by local assessors to be the total taxable value of land and additions on the property. | Land | Improvement |
|---|---|---|---|---|
| 2025 | $4,276 | $400,213 | $134,362 | $265,851 |
| 2024 | $4,276 | $392,365 | $131,727 | $260,638 |
| 2023 | $4,156 | $384,671 | $129,144 | $255,527 |
| 2022 | $4,101 | $377,129 | $126,612 | $250,517 |
| 2021 | $4,074 | $369,734 | $124,129 | $245,605 |
| 2020 | $4,003 | $365,943 | $122,856 | $243,087 |
| 2019 | $3,968 | $358,768 | $120,447 | $238,321 |
| 2018 | $3,912 | $351,733 | $118,085 | $233,648 |
| 2017 | $3,772 | $344,837 | $115,770 | $229,067 |
| 2016 | $3,624 | $338,075 | $113,500 | $224,575 |
| 2015 | $3,599 | $332,997 | $111,795 | $221,202 |
| 2014 | $3,488 | $326,474 | $109,605 | $216,869 |
Source: Public Records
Map
Nearby Homes
- 2453 S Marigold Place
- 2708 S Parkside Dr
- 2413 S Parco Ave
- 2535 S Imperial Place
- 2437 S Garfield Place
- 2424 S Lake Ave
- 1020 E Tam o Shanter Ct
- 1456 E Philadelphia St Unit 134
- 1456 E Philadelphia St Unit 378
- 1456 E Philadelphia St
- 1456 E Philadelphia St Unit 279
- 1456 E Philadelphia St Unit 132
- 1456 E Philadelphia St Unit 39
- 1456 E Philadelphia St Unit 41
- 1456 E Philadelphia St Unit 311
- 1456 E Philadelphia St Unit 158
- 1456 E Philadelphia St Unit 109
- 1456 E Philadelphia St Unit 351
- 1456 E Philadelphia St Unit 154
- 1219 E Oak Hill Dr
- 1207 E Oak Hill Dr
- 1225 E Oak Hill Dr
- 1201 E Oak Hill Dr
- 2517 S Amador Place
- 2516 S Amador Place
- 2438 S Calaveras Place
- 2432 S Calaveras Place
- 2444 S Calaveras Place
- 2523 S Amador Place
- 2516 S Calaveras Place
- 2522 S Amador Place
- 2426 S Calaveras Place
- 2522 S Calaveras Place
- 2529 S Amador Place
- 2528 S Amador Place
- 2420 S Calaveras Place
- 2528 S Calaveras Place
- 2511 S Calaveras Place
- 2535 S Amador Place