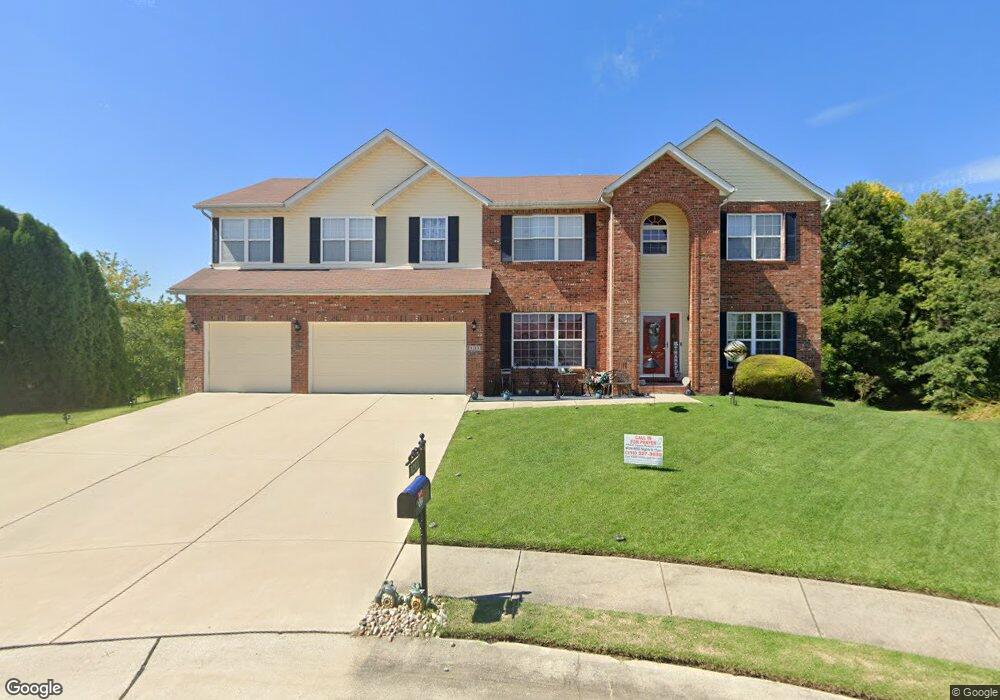
1213 High Valley Ln Belleville, IL 62221
Estimated Value: $357,000 - $474,000
--
Bed
--
Bath
2,048
Sq Ft
$213/Sq Ft
Est. Value
About This Home
This home is located at 1213 High Valley Ln, Belleville, IL 62221 and is currently estimated at $436,520, approximately $213 per square foot. 1213 High Valley Ln is a home located in St. Clair County with nearby schools including Whiteside Elementary School, Whiteside Middle School, and St. Clare Catholic School.
Ownership History
Date
Name
Owned For
Owner Type
Purchase Details
Closed on
Jan 6, 2022
Sold by
Stevenson Jesse L and Stevenson Othea
Bought by
Stevenson Jesse L
Current Estimated Value
Home Financials for this Owner
Home Financials are based on the most recent Mortgage that was taken out on this home.
Original Mortgage
$316,280
Outstanding Balance
$291,069
Interest Rate
3%
Mortgage Type
VA
Estimated Equity
$145,451
Purchase Details
Closed on
Oct 29, 2015
Sold by
Stevenson Jesse L and Stevenson Cindy V
Bought by
Stevenson Jesse L
Purchase Details
Closed on
Apr 25, 2006
Sold by
Stimson Construction Inc
Bought by
Stevenson Jesse L and Stevenson Cindy V
Home Financials for this Owner
Home Financials are based on the most recent Mortgage that was taken out on this home.
Original Mortgage
$331,292
Interest Rate
6.42%
Mortgage Type
VA
Create a Home Valuation Report for This Property
The Home Valuation Report is an in-depth analysis detailing your home's value as well as a comparison with similar homes in the area
Home Values in the Area
Average Home Value in this Area
Purchase History
| Date | Buyer | Sale Price | Title Company |
|---|---|---|---|
| Stevenson Jesse L | -- | None Available | |
| Stevenson Jesse L | -- | Attorney | |
| Stevenson Jesse L | $324,500 | Benchmark Title Company |
Source: Public Records
Mortgage History
| Date | Status | Borrower | Loan Amount |
|---|---|---|---|
| Open | Stevenson Jesse L | $316,280 | |
| Previous Owner | Stevenson Jesse L | $331,292 |
Source: Public Records
Tax History Compared to Growth
Tax History
| Year | Tax Paid | Tax Assessment Tax Assessment Total Assessment is a certain percentage of the fair market value that is determined by local assessors to be the total taxable value of land and additions on the property. | Land | Improvement |
|---|---|---|---|---|
| 2024 | -- | $137,668 | $21,621 | $116,047 |
| 2023 | -- | $125,755 | $21,322 | $104,433 |
| 2022 | $0 | $114,531 | $19,419 | $95,112 |
| 2021 | $0 | $109,830 | $18,622 | $91,208 |
| 2020 | $0 | $102,283 | $17,342 | $84,941 |
| 2019 | $6,622 | $103,686 | $18,935 | $84,751 |
| 2018 | $6,496 | $101,039 | $18,452 | $82,587 |
| 2017 | $6,538 | $98,349 | $17,961 | $80,388 |
| 2016 | $6,505 | $94,959 | $17,342 | $77,617 |
| 2014 | $6,498 | $97,424 | $15,079 | $82,345 |
| 2013 | $6,516 | $97,424 | $15,079 | $82,345 |
Source: Public Records
Map
Nearby Homes
- 2645 Katrine Lake Dr
- 2763 Cascade Lake Dr
- 2700 Crimson View Dr
- 1230 Three Rivers Dr Unit 6B
- 2708 Ambridge Dr
- Whitney Plan at Greystone Estates
- Franklin Plan at Greystone Estates
- Wright Plan at Greystone Estates
- Jefferson Plan at Greystone Estates
- Lynwood Plan at Greystone Estates
- Carnegie Plan at Greystone Estates
- 2604 Windsor Crest Ct
- 1278 Bainbridge Ct
- 2605 Cheyenne Wells Dr
- 2652 Cheyenne Wells Dr
- 1214 Carleton Ln
- 0 Hartman Ln
- 1232 Carleton Ln
- 869 Ashley Cove Ct
- 651 Glen Mor
- 1217 High Valley Ln
- 1209 High Valley Ln
- 1221 High Valley Ln
- 1205 High Valley Ln
- 1220 High Valley Ln
- 1225 High Valley Ln
- 2635 Lauren Lake Dr
- 2631 Lauren Lake Dr
- 2627 Lauren Lake Dr
- 1224 High Valley Ln
- 2617 Lauren Lake Dr
- 1229 High Valley Ln
- 2703 Lauren Lake Dr
- 2621 Lauren Lake Dr
- 2613 Lauren Lake Dr
- 1228 High Valley Ln
- 2707 Lauren Lake Dr
- 1233 High Valley Ln
- 2609 Lauren Lake Dr
- 1109 High Valley Ln