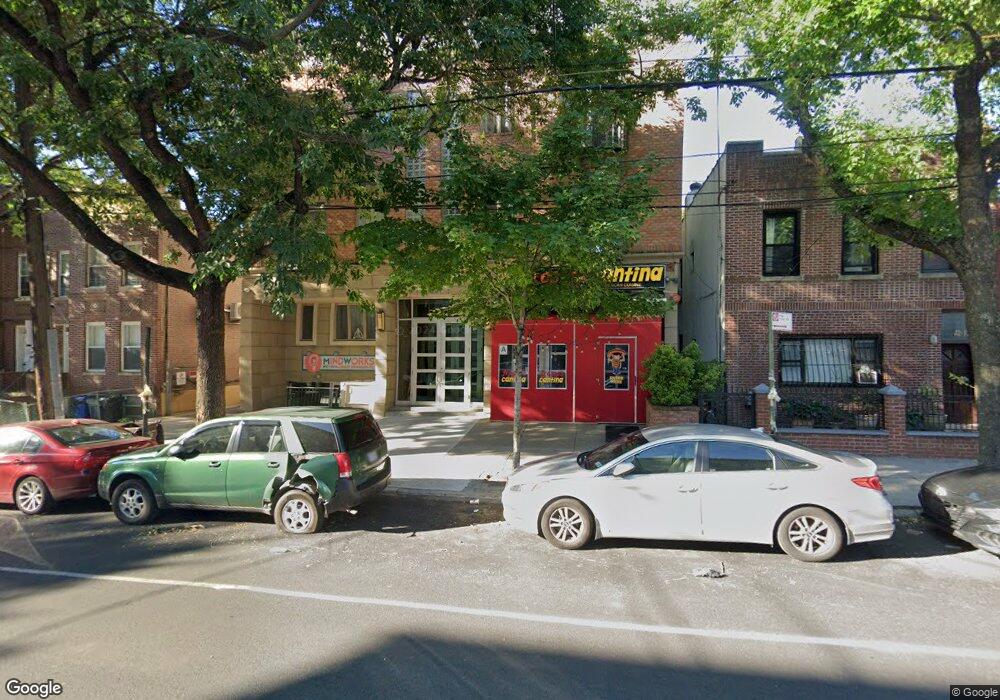
1214 31st Ave Unit 8 Astoria, NY 11106
Astoria NeighborhoodEstimated Value: $544,000 - $674,000
1
Bed
--
Bath
600
Sq Ft
$987/Sq Ft
Est. Value
About This Home
This home is located at 1214 31st Ave Unit 8, Astoria, NY 11106 and is currently estimated at $592,333, approximately $987 per square foot. 1214 31st Ave Unit 8 is a home located in Queens County with nearby schools including P.S.171 Peter G.Van Alst Elementary School, I.S. 126Q Albert Shanker School Community School, and Long Island City High School.
Ownership History
Date
Name
Owned For
Owner Type
Purchase Details
Closed on
Mar 23, 2017
Sold by
Pategas Thomas and Pategas Victoria
Bought by
Ng Ka Ming and Wu Wei
Current Estimated Value
Home Financials for this Owner
Home Financials are based on the most recent Mortgage that was taken out on this home.
Original Mortgage
$347,200
Outstanding Balance
$287,355
Interest Rate
4.1%
Mortgage Type
New Conventional
Estimated Equity
$304,978
Purchase Details
Closed on
Feb 19, 2013
Sold by
Aguirre Victoria and Pategas Thomas
Bought by
Pategas Thomas and Pategas Victoria
Home Financials for this Owner
Home Financials are based on the most recent Mortgage that was taken out on this home.
Original Mortgage
$335,000
Interest Rate
3.45%
Mortgage Type
New Conventional
Purchase Details
Closed on
Jul 6, 2007
Sold by
J H Loewy Development Corp
Bought by
Aguirre Victoria and Pategas Thomas
Create a Home Valuation Report for This Property
The Home Valuation Report is an in-depth analysis detailing your home's value as well as a comparison with similar homes in the area
Home Values in the Area
Average Home Value in this Area
Purchase History
| Date | Buyer | Sale Price | Title Company |
|---|---|---|---|
| Ng Ka Ming | $496,000 | -- | |
| Pategas Thomas | -- | -- | |
| Aguirre Victoria | $385,000 | -- |
Source: Public Records
Mortgage History
| Date | Status | Borrower | Loan Amount |
|---|---|---|---|
| Open | Ng Ka Ming | $347,200 | |
| Previous Owner | Pategas Thomas | $335,000 |
Source: Public Records
Tax History Compared to Growth
Tax History
| Year | Tax Paid | Tax Assessment Tax Assessment Total Assessment is a certain percentage of the fair market value that is determined by local assessors to be the total taxable value of land and additions on the property. | Land | Improvement |
|---|---|---|---|---|
| 2025 | $4,994 | $40,867 | $3,814 | $37,053 |
| 2024 | $4,994 | $39,945 | $3,814 | $36,131 |
| 2023 | $4,882 | $39,052 | $3,814 | $35,238 |
| 2022 | $4,588 | $41,573 | $3,814 | $37,759 |
| 2021 | $4,576 | $38,486 | $3,814 | $34,672 |
| 2020 | $2,935 | $42,722 | $3,814 | $38,908 |
| 2019 | $2,106 | $40,029 | $3,814 | $36,215 |
| 2018 | $1,395 | $30,592 | $3,814 | $26,778 |
| 2017 | $3,410 | $26,809 | $3,814 | $22,995 |
| 2016 | $781 | $26,809 | $3,814 | $22,995 |
| 2014 | $611 | $22,911 | $4,164 | $18,747 |
Source: Public Records
Map
Nearby Homes
- 31-13 12th St
- 12-14 31st Ave Unit 7 D
- 11-24 31st Ave Unit 15B
- 11-24 31st Ave Unit 18B
- 11-24 31st Ave Unit 10-E
- 11-24 31st Ave
- 11-24 31st Ave Unit 12A
- 11-24 31st Ave Unit 3A
- 11-24 31st Ave Unit 13C
- 11-32 31st Ave Unit 3D
- 11-32 31st Ave Unit 4 A
- 11-32 31st Ave Unit 2B
- 11-32 31st Ave Unit 6 B
- 11-32 31st Ave Unit 2D
- 11-32 31st Ave Unit 4D
- 1216 30th Dr
- 3085 Vernon Blvd Unit 3L
- 1425 31st Dr
- 1423 31st Ave Unit 4E
- 14-17 31st Ave Unit 2E
- 1214 31st Ave Unit 10
- 1214 31st Ave Unit 9D
- 1214 31st Ave Unit 7D
- 1214 31st Ave Unit 6
- 1214 31st Ave Unit 5
- 1214 31st Ave Unit 4
- 1214 31st Ave Unit 3
- 1214 31st Ave Unit 2
- 1214 31st Ave Unit 1
- 1214 31st Ave Unit 66
- 1214 31st Ave Unit 26
- 1214 31st Ave Unit 222
- 1214 31st Ave Unit CM
- 1214 31st Ave Unit CF
- 1214 31st Ave
- 1214 31st Ave Unit 9
- 1214 31st Ave Unit 9
- 1214 31st Ave
- 12-12 31st Ave
- 12-12 31st Ave Unit 2