


1215 N Gladstone Ave Indianapolis, IN 46201
Near Eastside Neighborhood
1
Bed
1
Bath
1,024
Sq Ft
5,401
Sq Ft Lot
Highlights
- Deck
- No HOA
- Bungalow
- Wood Flooring
- 2 Car Detached Garage
- 1-Story Property
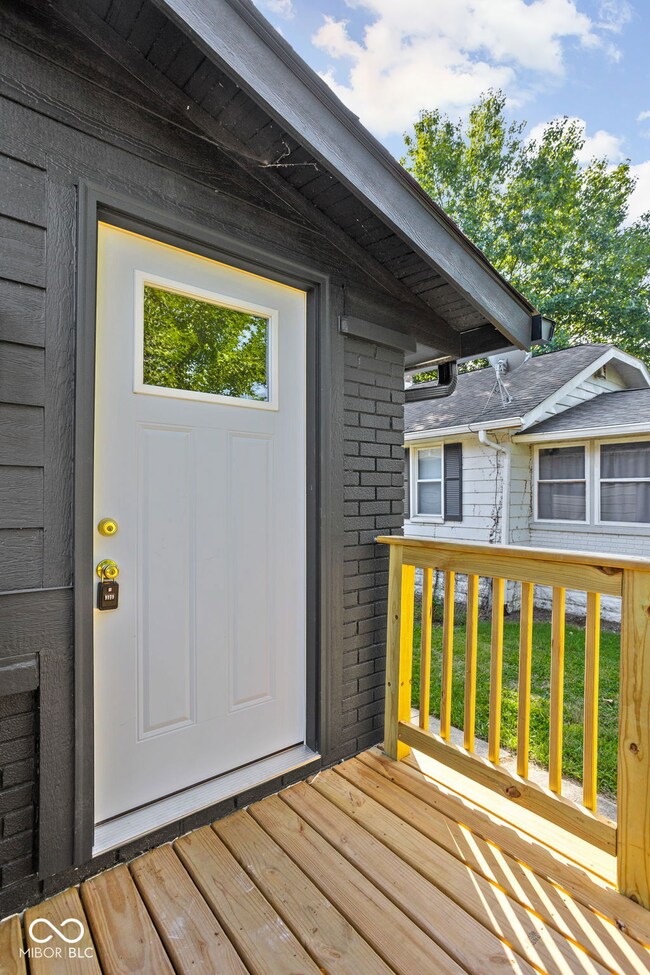
About This Home
As of May 2025Welcome to 1215 Gladstone Avenue! This home is a large 2 bedroom and 1 bathroom bungalow that has been fully renovated. It also has a 2 car garage and a newly painted dark exterior that will catch your Buyers eyes. In addition, you will see it has new dimensional shingle roof, new windows, as well as gutters. Inside you will find a well developed floor plan with custom kitchen, new granite countertops, and appliances. The rest of the home was fully renovated with newly refinished floors, and painted interior doors and trim. The bathroom is has been updated with light colored wall tile and decorative floor tile. Lastly, all mechanicals have been updated, so your Buyers will not have to worry about that expense! Come see this house before its sold!
Last Agent to Sell the Property
Highgarden Real Estate Brokerage Email: traviscurtisrealty@gmail.com License #RB17001561 Listed on: 09/14/2024
Last Buyer's Agent
Andrew Porter
@properties
Home Details
Home Type
- Single Family
Est. Annual Taxes
- $2,526
Year Built
- Built in 1927 | Remodeled
Parking
- 2 Car Detached Garage
Home Design
- Bungalow
- Brick Exterior Construction
- Block Foundation
- Aluminum Siding
Interior Spaces
- 1,024 Sq Ft Home
- 1-Story Property
- Vinyl Clad Windows
- Family or Dining Combination
- Wood Flooring
- Unfinished Basement
- Laundry in Basement
- Attic Access Panel
Kitchen
- Electric Cooktop
- Dishwasher
- Disposal
Bedrooms and Bathrooms
- 1 Bedroom
- 1 Full Bathroom
Utilities
- Forced Air Heating System
- Water Heater
Additional Features
- Deck
- 5,401 Sq Ft Lot
Community Details
- No Home Owners Association
- Johnson Subdivision
Listing and Financial Details
- Legal Lot and Block 148 / 1
- Assessor Parcel Number 490733178205000101
- Seller Concessions Not Offered
Ownership History
Date
Name
Owned For
Owner Type
Purchase Details
Listed on
Sep 14, 2024
Closed on
May 6, 2025
Sold by
Lucror Real Estate Llc
Bought by
Bowman Simon
Seller's Agent
Travis Curtis
Highgarden Real Estate
Buyer's Agent
Andrew Porter
@properties
List Price
$225,000
Sold Price
$173,500
Premium/Discount to List
-$51,500
-22.89%
Views
55
Home Financials for this Owner
Home Financials are based on the most recent Mortgage that was taken out on this home.
Avg. Annual Appreciation
-12.39%
Original Mortgage
$34,700
Outstanding Balance
$34,700
Interest Rate
6.65%
Mortgage Type
New Conventional
Estimated Equity
$134,269
Purchase Details
Listed on
Sep 18, 2023
Closed on
Dec 1, 2023
Sold by
Lbox Llc
Bought by
Lucror Real Estate Llc
Seller's Agent
Ryan Rominger
Trueblood Real Estate
Buyer's Agent
Travis Curtis
Hanza Realty, LLC
List Price
$89,900
Sold Price
$84,900
Premium/Discount to List
-$5,000
-5.56%
Views
44
Home Financials for this Owner
Home Financials are based on the most recent Mortgage that was taken out on this home.
Avg. Annual Appreciation
63.15%
Original Mortgage
$135,000
Interest Rate
7.79%
Mortgage Type
New Conventional
Purchase Details
Listed on
Jan 16, 2020
Closed on
Jun 30, 2020
Sold by
Longhorn 1993 Llc
Bought by
Lbox Llc
Seller's Agent
Maxwell Richter
Wilmoth Group
Buyer's Agent
Ray Podesta
Highgarden Real Estate
List Price
$850,000
Sold Price
$84,500
Premium/Discount to List
-$765,500
-90.06%
Home Financials for this Owner
Home Financials are based on the most recent Mortgage that was taken out on this home.
Avg. Annual Appreciation
0.14%
Original Mortgage
$58,050
Interest Rate
3.1%
Mortgage Type
New Conventional
Purchase Details
Listed on
Mar 15, 2017
Closed on
Oct 4, 2017
Sold by
Bill L
Seller's Agent
Roy Wilson
F.C. Tucker Company
Buyer's Agent
Jennifer Wilmoth
Wilmoth Group
List Price
$44,900
Sold Price
$36,500
Premium/Discount to List
-$8,400
-18.71%
Home Financials for this Owner
Home Financials are based on the most recent Mortgage that was taken out on this home.
Avg. Annual Appreciation
35.40%
Similar Homes in Indianapolis, IN
Create a Home Valuation Report for This Property
The Home Valuation Report is an in-depth analysis detailing your home's value as well as a comparison with similar homes in the area
Home Values in the Area
Average Home Value in this Area
Purchase History
| Date | Type | Sale Price | Title Company |
|---|---|---|---|
| Warranty Deed | -- | Security Title | |
| Warranty Deed | $84,900 | First American Title | |
| Warranty Deed | $84,500 | Meridian Title Corporation | |
| Deed | $36,500 | -- | |
| Warranty Deed | $36,500 | First American Title |
Source: Public Records
Mortgage History
| Date | Status | Loan Amount | Loan Type |
|---|---|---|---|
| Open | $34,700 | New Conventional | |
| Open | $121,020 | New Conventional | |
| Previous Owner | $135,000 | New Conventional | |
| Previous Owner | $58,050 | New Conventional |
Source: Public Records
Property History
| Date | Event | Price | Change | Sq Ft Price |
|---|---|---|---|---|
| 05/07/2025 05/07/25 | Sold | $173,500 | -3.0% | $169 / Sq Ft |
| 04/07/2025 04/07/25 | Pending | -- | -- | -- |
| 03/17/2025 03/17/25 | Price Changed | $178,900 | -0.6% | $175 / Sq Ft |
| 01/03/2025 01/03/25 | Price Changed | $179,990 | -5.3% | $176 / Sq Ft |
| 12/16/2024 12/16/24 | Price Changed | $189,998 | 0.0% | $186 / Sq Ft |
| 11/20/2024 11/20/24 | Price Changed | $189,999 | 0.0% | $186 / Sq Ft |
| 11/07/2024 11/07/24 | Price Changed | $190,000 | -7.3% | $186 / Sq Ft |
| 10/26/2024 10/26/24 | Price Changed | $205,000 | 0.0% | $200 / Sq Ft |
| 10/10/2024 10/10/24 | Price Changed | $204,999 | -4.7% | $200 / Sq Ft |
| 10/08/2024 10/08/24 | Price Changed | $214,999 | -2.3% | $210 / Sq Ft |
| 10/03/2024 10/03/24 | Price Changed | $219,999 | -2.2% | $215 / Sq Ft |
| 09/14/2024 09/14/24 | For Sale | $225,000 | +165.0% | $220 / Sq Ft |
| 11/22/2023 11/22/23 | Sold | $84,900 | -5.6% | $92 / Sq Ft |
| 10/23/2023 10/23/23 | Pending | -- | -- | -- |
| 10/21/2023 10/21/23 | For Sale | $89,900 | 0.0% | $98 / Sq Ft |
| 09/21/2023 09/21/23 | Pending | -- | -- | -- |
| 09/18/2023 09/18/23 | For Sale | $89,900 | 0.0% | $98 / Sq Ft |
| 07/16/2021 07/16/21 | Rented | -- | -- | -- |
| 07/12/2021 07/12/21 | Under Contract | -- | -- | -- |
| 06/24/2021 06/24/21 | For Rent | $765 | 0.0% | -- |
| 07/10/2020 07/10/20 | Sold | $84,500 | +14101.7% | $65 / Sq Ft |
| 05/28/2020 05/28/20 | Pending | -- | -- | -- |
| 05/18/2020 05/18/20 | Rented | $595 | 0.0% | -- |
| 05/13/2020 05/13/20 | Under Contract | -- | -- | -- |
| 05/11/2020 05/11/20 | Price Changed | $595 | 0.0% | $1 / Sq Ft |
| 04/24/2020 04/24/20 | Price Changed | $89,900 | 0.0% | $69 / Sq Ft |
| 04/14/2020 04/14/20 | Price Changed | $645 | -7.2% | $1 / Sq Ft |
| 03/24/2020 03/24/20 | Price Changed | $695 | -6.7% | $1 / Sq Ft |
| 02/25/2020 02/25/20 | Price Changed | $745 | -6.3% | $1 / Sq Ft |
| 02/06/2020 02/06/20 | For Rent | $795 | 0.0% | -- |
| 01/16/2020 01/16/20 | For Sale | $850,000 | 0.0% | $656 / Sq Ft |
| 03/30/2018 03/30/18 | Rented | $725 | 0.0% | -- |
| 03/21/2018 03/21/18 | Under Contract | -- | -- | -- |
| 02/19/2018 02/19/18 | Price Changed | $725 | -3.3% | $1 / Sq Ft |
| 01/12/2018 01/12/18 | For Rent | $750 | 0.0% | -- |
| 10/04/2017 10/04/17 | Sold | $36,500 | -8.5% | $28 / Sq Ft |
| 08/04/2017 08/04/17 | Pending | -- | -- | -- |
| 04/13/2017 04/13/17 | Price Changed | $39,900 | -11.1% | $31 / Sq Ft |
| 03/15/2017 03/15/17 | For Sale | $44,900 | -- | $35 / Sq Ft |
Source: MIBOR Broker Listing Cooperative®
Tax History Compared to Growth
Tax History
| Year | Tax Paid | Tax Assessment Tax Assessment Total Assessment is a certain percentage of the fair market value that is determined by local assessors to be the total taxable value of land and additions on the property. | Land | Improvement |
|---|---|---|---|---|
| 2024 | $2,714 | $105,400 | $13,100 | $92,300 |
| 2023 | $2,714 | $110,700 | $13,100 | $97,600 |
| 2022 | $2,612 | $107,000 | $13,100 | $93,900 |
| 2021 | $2,207 | $92,000 | $13,100 | $78,900 |
| 2020 | $1,988 | $82,300 | $5,000 | $77,300 |
| 2019 | $1,974 | $80,200 | $5,000 | $75,200 |
| 2018 | $1,715 | $68,700 | $5,000 | $63,700 |
| 2017 | $1,432 | $63,800 | $5,000 | $58,800 |
| 2016 | $1,338 | $60,800 | $5,000 | $55,800 |
| 2014 | $1,364 | $63,100 | $5,000 | $58,100 |
| 2013 | $548 | $63,100 | $5,000 | $58,100 |
Source: Public Records
Agents Affiliated with this Home
-
Travis Curtis
Seller's Agent in 2025
Travis Curtis
Highgarden Real Estate
(317) 650-1459
11 in this area
35 Total Sales
-
A
Buyer's Agent in 2025
Andrew Porter
@properties
-
Ryan Rominger
Seller's Agent in 2023
Ryan Rominger
Trueblood Real Estate
(317) 935-0075
32 in this area
153 Total Sales
-
Maxwell Richter
Seller's Agent in 2021
Maxwell Richter
Wilmoth Group
(317) 842-3400
46 in this area
260 Total Sales
-
Joel Wilmoth
J
Buyer's Agent in 2020
Joel Wilmoth
Wilmoth Group
(317) 622-5023
5 Total Sales
-
R
Buyer's Agent in 2020
Ray Podesta
Highgarden Real Estate
Map
Source: MIBOR Broker Listing Cooperative®
MLS Number: 22001663
APN: 49-07-33-178-205.000-101
Disclaimer: Certain information contained herein is derived from information provided by parties other than Homes.com. All information provided is deemed reliable, but is not guaranteed to be accurate and should be independently verified.
![]() Based on information submitted to the MLS GRID. All data is obtained from various sources and may not have been verified by broker or MLS GRID. Supplied Open House Information is subject to change without notice. All information should be independently reviewed and verified for accuracy. Properties may or may not be listed by the office/agent presenting the information. Some IDX listings have been excluded from this website.
Based on information submitted to the MLS GRID. All data is obtained from various sources and may not have been verified by broker or MLS GRID. Supplied Open House Information is subject to change without notice. All information should be independently reviewed and verified for accuracy. Properties may or may not be listed by the office/agent presenting the information. Some IDX listings have been excluded from this website.
Nearby Homes
- 1206 N Gladstone Ave
- 1125 N Colorado Ave
- 1409 N Grant Ave
- 1411 N Grant Ave
- 1425 N Grant Ave
- 1328 N Chester Ave
- 1311 N Denny St
- 4014 E 10th St
- 3916 E 10th St
- 1433 N Colorado Ave
- 4412 E 10th St
- 1472 N Grant Ave
- 940 N Grant Ave
- 1437 Shannon Ave
- 1411 N Linwood Ave
- 1517 N Gladstone Ave
- 1521 N Gladstone Ave
- 1444 N Denny St
- 923 N Denny St
- 1538 N Grant Ave