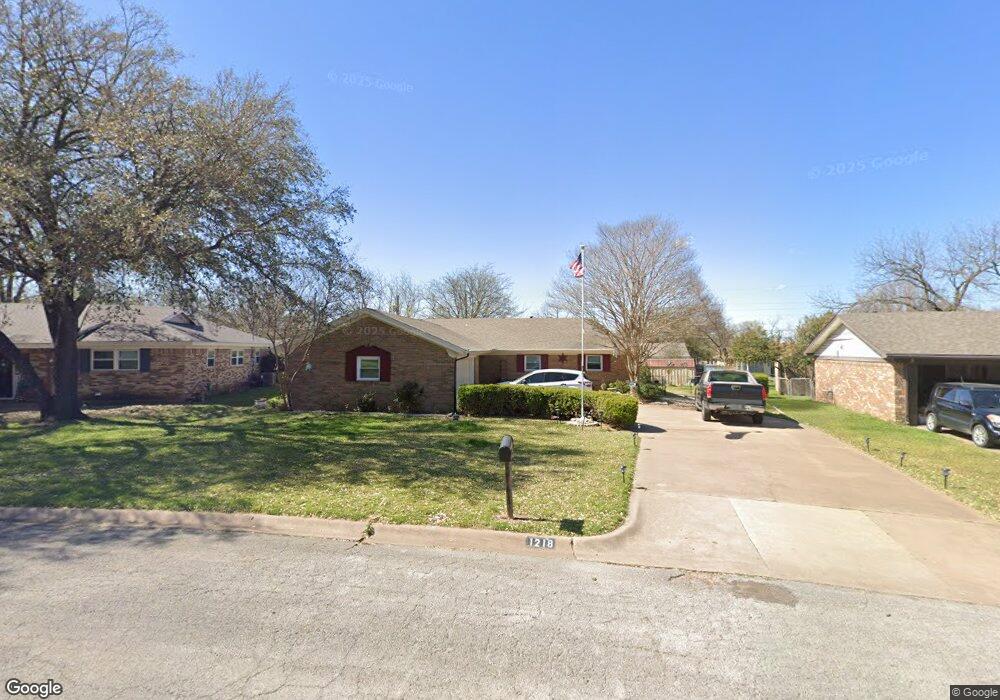
1218 Briarwood Dr Cleburne, TX 76033
Estimated Value: $238,365 - $249,000
3
Beds
2
Baths
1,456
Sq Ft
$167/Sq Ft
Est. Value
About This Home
This home is located at 1218 Briarwood Dr, Cleburne, TX 76033 and is currently estimated at $242,841, approximately $166 per square foot. 1218 Briarwood Dr is a home located in Johnson County with nearby schools including Coleman Elementary School, Lowell Smith Jr. Middle School, and Cleburne High School.
Ownership History
Date
Name
Owned For
Owner Type
Purchase Details
Closed on
Jul 10, 2015
Sold by
Moring Emily and Moring Matthew
Bought by
Albrycht John P and Albrycht Sandra D
Current Estimated Value
Home Financials for this Owner
Home Financials are based on the most recent Mortgage that was taken out on this home.
Original Mortgage
$108,000
Outstanding Balance
$84,124
Interest Rate
3.91%
Mortgage Type
New Conventional
Estimated Equity
$158,717
Purchase Details
Closed on
Feb 25, 2005
Sold by
Waldrop Patricia and Waldrop Patricia Jean
Bought by
Moring Emily and Moring Matthew
Home Financials for this Owner
Home Financials are based on the most recent Mortgage that was taken out on this home.
Original Mortgage
$106,000
Interest Rate
5.71%
Mortgage Type
New Conventional
Create a Home Valuation Report for This Property
The Home Valuation Report is an in-depth analysis detailing your home's value as well as a comparison with similar homes in the area
Home Values in the Area
Average Home Value in this Area
Purchase History
| Date | Buyer | Sale Price | Title Company |
|---|---|---|---|
| Albrycht John P | -- | Stnt | |
| Moring Emily | -- | Fatco |
Source: Public Records
Mortgage History
| Date | Status | Borrower | Loan Amount |
|---|---|---|---|
| Open | Albrycht John P | $108,000 | |
| Previous Owner | Moring Emily | $106,000 |
Source: Public Records
Tax History Compared to Growth
Tax History
| Year | Tax Paid | Tax Assessment Tax Assessment Total Assessment is a certain percentage of the fair market value that is determined by local assessors to be the total taxable value of land and additions on the property. | Land | Improvement |
|---|---|---|---|---|
| 2025 | $1,007 | $224,222 | $50,500 | $173,722 |
| 2024 | $1,007 | $224,222 | $50,500 | $173,722 |
| 2023 | $1,007 | $224,222 | $50,500 | $173,722 |
| 2022 | $4,531 | $193,267 | $42,500 | $150,767 |
| 2021 | $4,294 | $167,536 | $36,000 | $131,536 |
| 2020 | $4,146 | $149,613 | $25,000 | $124,613 |
| 2019 | $4,113 | $146,151 | $25,000 | $121,151 |
| 2018 | $3,740 | $146,151 | $25,000 | $121,151 |
| 2017 | $3,386 | $117,989 | $25,000 | $92,989 |
| 2016 | $3,078 | $104,571 | $20,000 | $84,571 |
| 2015 | $2,361 | $96,642 | $20,000 | $76,642 |
| 2014 | $2,361 | $100,269 | $20,000 | $80,269 |
Source: Public Records
Map
Nearby Homes
- 1204 W Westhill Dr
- 1225 Crestwood Dr
- 800 Misty Ln
- 504 S Colonial Dr
- 1116 Willowcreek Rd
- 1103 Trace Rd
- 1309 Wedgewood Dr
- 806 S Colonial Dr
- 1211 Greenbriar Ln
- 1115 Green River Trail
- 709 Stonelake Dr
- 4112 Highland Dr
- 4101 Highland Dr
- 840 S Ridgeway Dr
- 909 Highland Dr
- 1208 Cindy Ln
- 1302 Cindy Ct
- 325 Wildrose Cir
- 380 Wildrose Cir
- 1327 Hemphill Dr
- 1220 Briarwood Dr
- 1216 Briarwood Dr
- 1219 Tanglewood Dr
- 1221 Tanglewood Dr
- 1217 Tanglewood Dr
- 1214 Briarwood Dr
- 1223 Tanglewood Dr
- 1222 Briarwood Dr
- 1217 Briarwood Dr
- 1221 Briarwood Dr
- 1215 Tanglewood Dr
- 1225 Tanglewood Dr
- 1215 Briarwood Dr
- 1212 Briarwood Dr
- 1213 Tanglewood Dr
- 1227 Tanglewood Dr
- 1213 Briarwood Dr
- 1218 Tanglewood Dr
- 1220 Tanglewood Dr
- 1210 Crestwood Dr