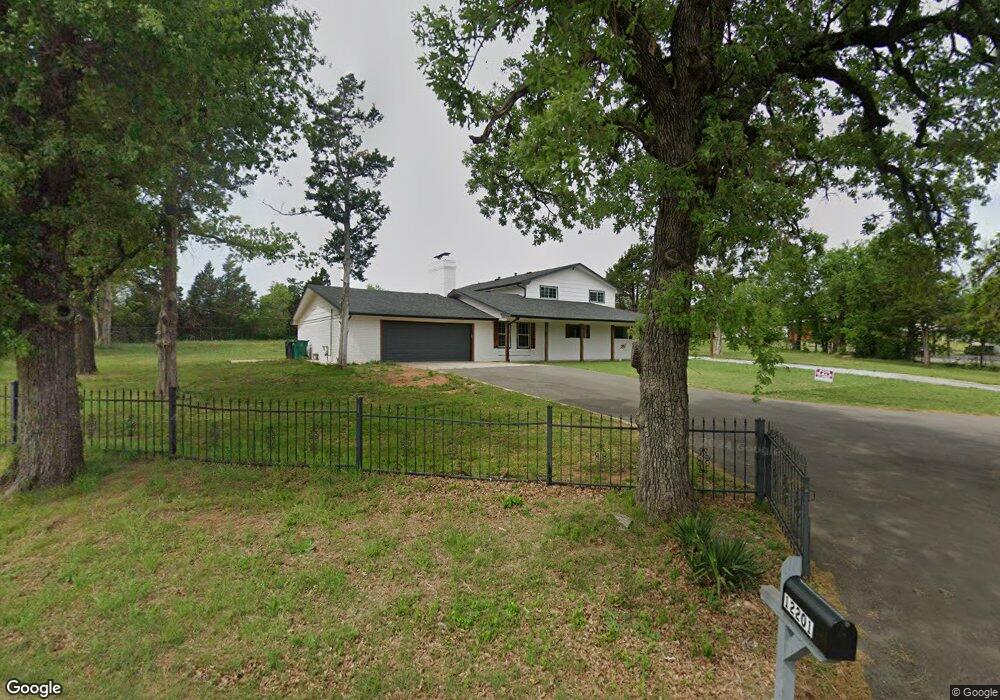
12201 Bell Oak Rd Edmond, OK 73013
Southwest Edmond NeighborhoodEstimated Value: $351,000 - $606,000
3
Beds
3
Baths
3,274
Sq Ft
$143/Sq Ft
Est. Value
About This Home
This home is located at 12201 Bell Oak Rd, Edmond, OK 73013 and is currently estimated at $468,224, approximately $143 per square foot. 12201 Bell Oak Rd is a home located in Oklahoma County with nearby schools including Britton Elementary School, John Marshall Enterprise Middle School, and John Marshall Enterprise High School.
Ownership History
Date
Name
Owned For
Owner Type
Purchase Details
Closed on
Jun 12, 2025
Sold by
Singh Ranjit and Sharma Rohit
Bought by
Klabzuba Stephen
Current Estimated Value
Home Financials for this Owner
Home Financials are based on the most recent Mortgage that was taken out on this home.
Original Mortgage
$510,000
Outstanding Balance
$508,691
Interest Rate
6.81%
Mortgage Type
New Conventional
Estimated Equity
-$40,467
Purchase Details
Closed on
Dec 21, 2020
Sold by
Davis Anna Marie and Davis Jim
Bought by
Myers Investments Group Llc
Purchase Details
Closed on
Nov 10, 2020
Sold by
Davis Anna Marie and Davis Jim
Bought by
Myers Investment Group Llc
Purchase Details
Closed on
Nov 6, 2020
Sold by
Myers Investment Group Llc
Bought by
Singh Ranjit and Sharma Rohit
Create a Home Valuation Report for This Property
The Home Valuation Report is an in-depth analysis detailing your home's value as well as a comparison with similar homes in the area
Home Values in the Area
Average Home Value in this Area
Purchase History
| Date | Buyer | Sale Price | Title Company |
|---|---|---|---|
| Klabzuba Stephen | $600,000 | First American Title | |
| Klabzuba Stephen | $600,000 | First American Title | |
| Myers Investments Group Llc | -- | Oklahoma City Abstract & Ttl | |
| Myers Investment Group Llc | $107,500 | Oklahoma City Abstract & Ttl | |
| Singh Ranjit | $200,000 | Oklahoma City Abtsract & Ttl |
Source: Public Records
Mortgage History
| Date | Status | Borrower | Loan Amount |
|---|---|---|---|
| Open | Klabzuba Stephen | $510,000 | |
| Closed | Klabzuba Stephen | $510,000 |
Source: Public Records
Tax History Compared to Growth
Tax History
| Year | Tax Paid | Tax Assessment Tax Assessment Total Assessment is a certain percentage of the fair market value that is determined by local assessors to be the total taxable value of land and additions on the property. | Land | Improvement |
|---|---|---|---|---|
| 2024 | $3,344 | $48,992 | $1,884 | $47,108 |
| 2023 | $3,344 | $27,225 | $2,057 | $25,168 |
| 2022 | $3,050 | $25,929 | $1,687 | $24,242 |
| 2021 | $2,907 | $24,695 | $2,244 | $22,451 |
| 2020 | $2,874 | $25,135 | $2,244 | $22,891 |
| 2019 | $2,811 | $24,624 | $2,106 | $22,518 |
| 2018 | $2,599 | $23,907 | $0 | $0 |
| 2017 | $2,656 | $24,432 | $4,157 | $20,275 |
| 2016 | $2,577 | $23,720 | $4,036 | $19,684 |
| 2015 | $2,522 | $23,030 | $4,526 | $18,504 |
| 2014 | $2,432 | $22,359 | $2,940 | $19,419 |
Source: Public Records
Map
Nearby Homes
- 3820 Old Forest Ln
- 4005 NE 122nd St
- 11801 Old Mill Rd
- 4100 Oakdale Forest Rd
- 11649 Mill Hollow Ct
- 2701 Twin Creek Dr
- 3416 NE 115th St
- 11805 Gwendolyn Ln
- 4405 NE 125th Ct
- 4004 Oakdale Farm Cir
- 21 Oakdale Farm Cir
- 13209 Golden Eagle Dr
- 4200 Oakdale Farm Cir
- 3109 Eagle Crest Rd
- 4101 Oakdale Farm Cir
- 2912 NE 133rd St
- 2817 Shady Tree Ln
- 13509 Silver Eagle Trail
- 16308 Marsha Dr
- 8201 N Bryant Ave
- 12200 Bell Oak Rd
- 12321 Bell Oak Rd
- 3504 NE 122nd St
- 12325 Bell Oak Rd
- 12300 Dutch Forest Place
- 12324 Bell Oak Rd
- 12401 Bell Oak Rd
- 12400 Bell Oak Rd
- 0 None Such Rd
- 3501 NE 122nd St
- 3420 NE 122nd St
- 12301 Dutch Forest Place
- 3300 NE 122nd St
- 12201 Stonemill Rd
- 12121 Stonemill Rd
- 12405 Bell Oak Rd
- 12401 Dutch Forest Place
- 12215 Stonemill Rd
- 3310 NE 122nd St
- 12401 Roberts Rd