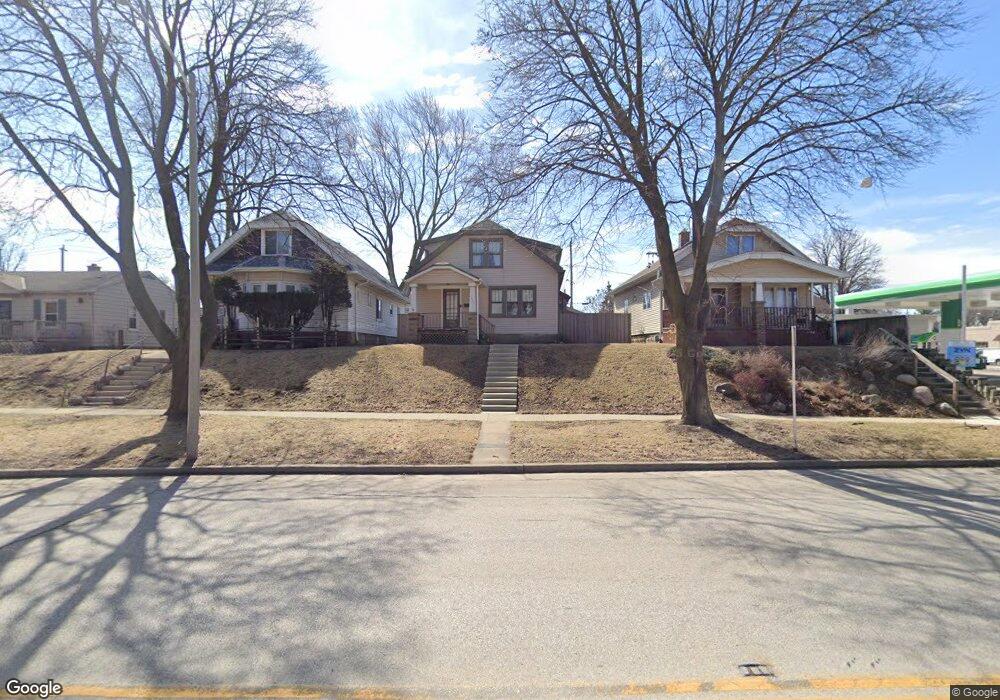
1221 E Oklahoma Ave Milwaukee, WI 53207
Bay View NeighborhoodEstimated Value: $315,252 - $385,000
3
Beds
1
Bath
1,420
Sq Ft
$247/Sq Ft
Est. Value
About This Home
This home is located at 1221 E Oklahoma Ave, Milwaukee, WI 53207 and is currently estimated at $350,313, approximately $246 per square foot. 1221 E Oklahoma Ave is a home located in Milwaukee County with nearby schools including Milwaukee Spanish Immersion School - Upper Campus, Milwaukee German Immersion School, and Craig Montessori School.
Ownership History
Date
Name
Owned For
Owner Type
Purchase Details
Closed on
Aug 25, 2020
Sold by
Holcombe John T
Bought by
Nothem Meghan
Current Estimated Value
Home Financials for this Owner
Home Financials are based on the most recent Mortgage that was taken out on this home.
Original Mortgage
$238,000
Outstanding Balance
$211,209
Interest Rate
2.9%
Mortgage Type
New Conventional
Estimated Equity
$139,104
Purchase Details
Closed on
Dec 4, 2015
Sold by
Anderson Brianne P
Bought by
Anderson Brianne P and Miller Timothy
Purchase Details
Closed on
Aug 6, 2015
Sold by
Santiago Lisa J
Bought by
Anderson Brianne
Purchase Details
Closed on
Apr 6, 2001
Sold by
Kubesh Lewis S and Kubesh Lorraine A
Bought by
Santiago Lisa J
Home Financials for this Owner
Home Financials are based on the most recent Mortgage that was taken out on this home.
Original Mortgage
$81,700
Interest Rate
7.03%
Mortgage Type
Purchase Money Mortgage
Create a Home Valuation Report for This Property
The Home Valuation Report is an in-depth analysis detailing your home's value as well as a comparison with similar homes in the area
Home Values in the Area
Average Home Value in this Area
Purchase History
| Date | Buyer | Sale Price | Title Company |
|---|---|---|---|
| Nothem Meghan | $258,000 | None Available | |
| Anderson Brianne P | $67,500 | Attorney | |
| Anderson Brianne | $100,000 | -- | |
| Santiago Lisa J | $86,000 | -- |
Source: Public Records
Mortgage History
| Date | Status | Borrower | Loan Amount |
|---|---|---|---|
| Open | Nothem Meghan | $238,000 | |
| Previous Owner | Santiago Lisa J | $81,700 |
Source: Public Records
Tax History Compared to Growth
Tax History
| Year | Tax Paid | Tax Assessment Tax Assessment Total Assessment is a certain percentage of the fair market value that is determined by local assessors to be the total taxable value of land and additions on the property. | Land | Improvement |
|---|---|---|---|---|
| 2024 | $5,034 | $235,600 | $22,800 | $212,800 |
| 2023 | $4,875 | $206,300 | $22,800 | $183,500 |
| 2022 | $4,597 | $206,300 | $22,800 | $183,500 |
| 2021 | $4,343 | $177,300 | $22,800 | $154,500 |
| 2020 | $4,381 | $177,300 | $22,800 | $154,500 |
| 2019 | $3,969 | $146,800 | $30,600 | $116,200 |
| 2018 | $3,568 | $146,800 | $30,600 | $116,200 |
| 2017 | $3,743 | $139,800 | $14,400 | $125,400 |
| 2016 | $3,888 | $138,100 | $14,400 | $123,700 |
| 2015 | $3,867 | $134,500 | $14,400 | $120,100 |
| 2014 | $4,038 | $137,400 | $14,400 | $123,000 |
| 2013 | -- | $130,900 | $14,400 | $116,500 |
Source: Public Records
Map
Nearby Homes
- 3167 S Hanson Ave
- 3222 S Logan Ave
- 1512 E Oklahoma Ave
- 3005 S Hanson Ave
- 2900 S Clement Ave
- 2867 S Linebarger Terrace
- 1821 E Oklahoma Ave
- 1803 E Rusk Ave
- 1005 E Holt Ave
- 3423 S Clement Ave
- 814 E Holt Ave
- 2900 S Kinnickinnic Ave
- 2754 S Logan Ave Unit 2756
- 2823 S Delaware Ave
- 2730 S Lenox St
- 3290 S Dayfield Ave
- 2643 S Linebarger Terrace
- 3146 S Kinnickinnic Ave
- 3156 S Kinnickinnic Ave
- 1705 E Eden Place
- 1215 E Oklahoma Ave
- 1227 E Oklahoma Ave
- 1231 E Oklahoma Ave
- 3121 S California St
- 3118 S Clement Ave
- 3125 S California St
- 3122 S Clement Ave
- 3129 S California St
- 1301 E Oklahoma Ave
- 3130 S Clement Ave
- 3133 S California St
- 1218 E Oklahoma Ave Unit 1220
- 1224 E Oklahoma Ave Unit 1226
- 1212 E Oklahoma Ave Unit 1214
- 3134 S Clement Ave
- 3137 S California St
- 3120 S California St
- 1313 E Oklahoma Ave
- 1300 E Oklahoma Ave Unit 1302
- 3138 S Clement Ave Unit 3142