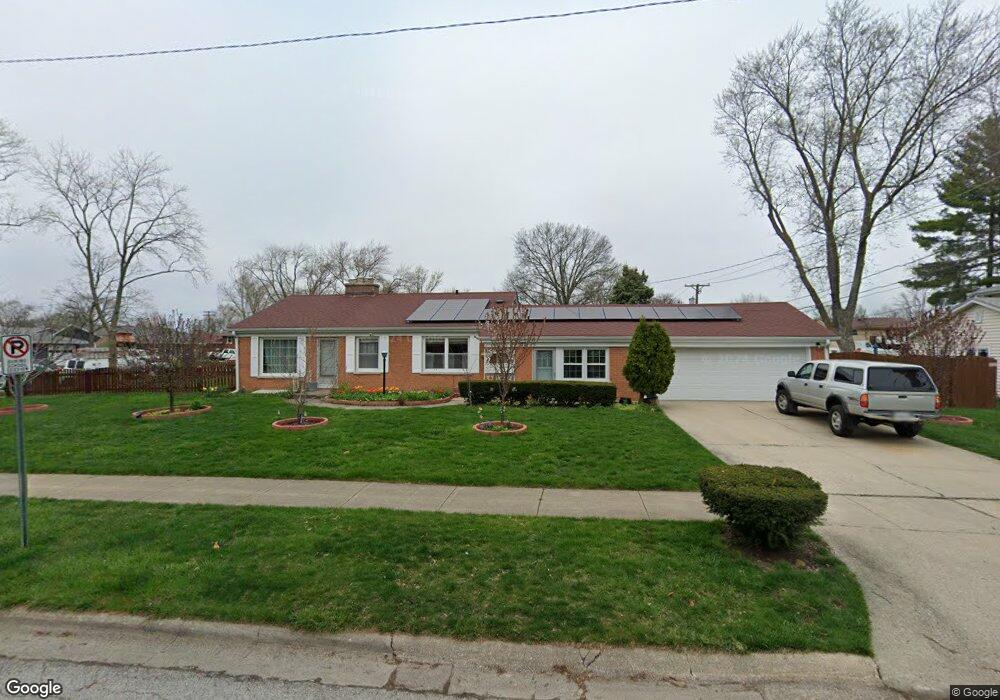
1221 Ottawa Ave Aurora, IL 60506
Blackhawk NeighborhoodEstimated Value: $262,000 - $304,022
3
Beds
1
Bath
1,528
Sq Ft
$189/Sq Ft
Est. Value
About This Home
This home is located at 1221 Ottawa Ave, Aurora, IL 60506 and is currently estimated at $289,006, approximately $189 per square foot. 1221 Ottawa Ave is a home located in Kane County with nearby schools including Mccleery Elementary School, Jefferson Middle School, and West Aurora High School.
Ownership History
Date
Name
Owned For
Owner Type
Purchase Details
Closed on
Jan 22, 2011
Sold by
Zepeda Vicente and Zepeda Maria L
Bought by
Zepeda Vicente and Zepeda Maria L
Current Estimated Value
Home Financials for this Owner
Home Financials are based on the most recent Mortgage that was taken out on this home.
Original Mortgage
$145,642
Outstanding Balance
$4,344
Interest Rate
4.25%
Mortgage Type
FHA
Estimated Equity
$284,662
Purchase Details
Closed on
Apr 30, 2003
Sold by
Keene Sylvia
Bought by
Zepeda Vincente and Zepeda Maria L
Home Financials for this Owner
Home Financials are based on the most recent Mortgage that was taken out on this home.
Original Mortgage
$167,272
Interest Rate
5.71%
Mortgage Type
FHA
Purchase Details
Closed on
May 31, 2002
Sold by
Schuldt Arnold F
Bought by
Schuldt Arnold F and Keene Sylvia L
Create a Home Valuation Report for This Property
The Home Valuation Report is an in-depth analysis detailing your home's value as well as a comparison with similar homes in the area
Home Values in the Area
Average Home Value in this Area
Purchase History
| Date | Buyer | Sale Price | Title Company |
|---|---|---|---|
| Zepeda Vicente | -- | Citywide Title Corporation | |
| Zepeda Vincente | $150,000 | Chicago Title Insurance Co | |
| Schuldt Arnold F | -- | -- |
Source: Public Records
Mortgage History
| Date | Status | Borrower | Loan Amount |
|---|---|---|---|
| Open | Zepeda Vicente | $145,642 | |
| Previous Owner | Zepeda Vincente | $167,272 |
Source: Public Records
Tax History Compared to Growth
Tax History
| Year | Tax Paid | Tax Assessment Tax Assessment Total Assessment is a certain percentage of the fair market value that is determined by local assessors to be the total taxable value of land and additions on the property. | Land | Improvement |
|---|---|---|---|---|
| 2024 | $6,011 | $83,914 | $13,876 | $70,038 |
| 2023 | $5,737 | $74,977 | $12,398 | $62,579 |
| 2022 | $5,525 | $68,410 | $11,312 | $57,098 |
| 2021 | $5,271 | $63,691 | $10,532 | $53,159 |
| 2020 | $4,977 | $59,160 | $9,783 | $49,377 |
| 2019 | $5,254 | $59,730 | $9,064 | $50,666 |
| 2018 | $4,711 | $53,192 | $8,384 | $44,808 |
| 2017 | $5,719 | $61,569 | $7,725 | $53,844 |
| 2016 | $4,953 | $52,627 | $6,622 | $46,005 |
| 2015 | -- | $45,871 | $5,694 | $40,177 |
| 2014 | -- | $42,494 | $5,233 | $37,261 |
| 2013 | -- | $42,404 | $5,674 | $36,730 |
Source: Public Records
Map
Nearby Homes
- 1104 New Haven Ave
- 1351 Monomoy St Unit D
- 1389 Monomoy St Unit B2
- 833 N Randall Rd Unit C4
- 781 N Elmwood Dr
- 943 Charles St
- 795 N Elmwood Dr
- 616 Morton Ave
- 900 Charles St
- 930 W New York St Unit 932
- 809 W Park Ave
- 972 Westgate Dr
- 231 W Downer Place
- 115 Hillwood Place Unit 4B
- 931 W Downer Place
- 1296 Yellowpine Dr
- 850 W Galena Blvd
- 113 Stonewood Place Unit 6D
- 1035 Newcastle Ln
- 1735 Greene Ct
- 635 Iroquois Dr
- 1215 Ottawa Ave
- 641 Iroquois Dr
- 613 Iroquois Dr Unit 2
- 1209 Ottawa Ave
- 626 Iroquois Dr Unit 2
- 632 Iroquois Dr
- 1214 Ottawa Ave
- 1214 W Illinois Ave
- 620 Iroquois Dr
- 645 Iroquois Dr
- 638 Iroquois Dr Unit 2
- 1205 Ottawa Ave
- 1200 Ottawa Ave
- 1208 W Illinois Ave Unit 1
- 614 Iroquois Dr
- 607 Iroquois Dr
- 1236 W Illinois Ave Unit 2
- 1200 W Illinois Ave
- 1170 Ottawa Ave