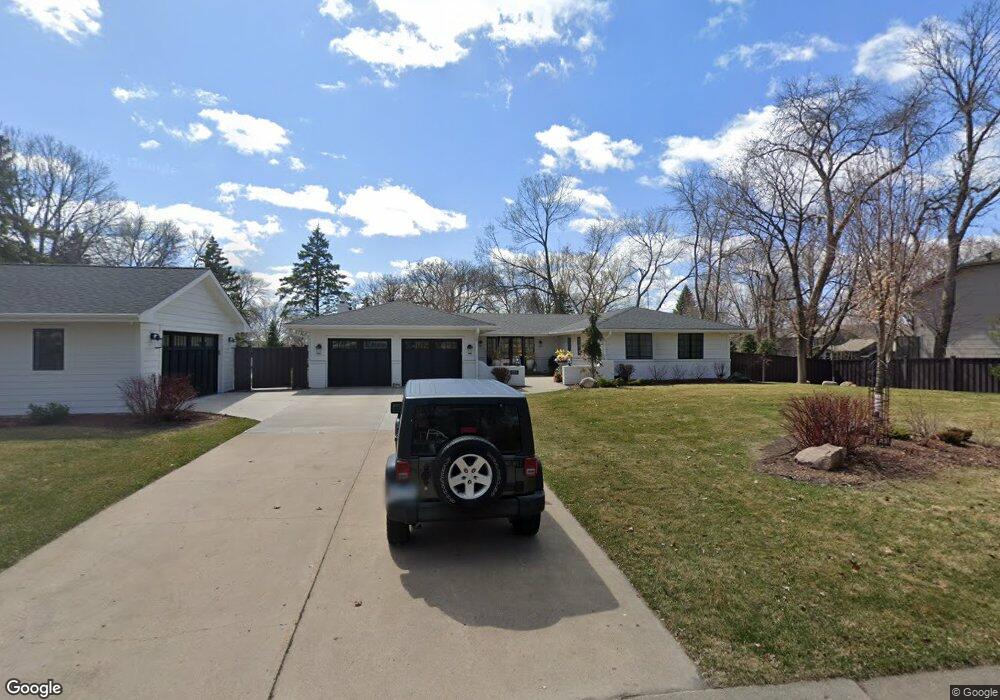
12215 60th Ave N Plymouth, MN 55442
Estimated Value: $923,000 - $1,128,009
5
Beds
5
Baths
4,482
Sq Ft
$235/Sq Ft
Est. Value
About This Home
This home is located at 12215 60th Ave N, Plymouth, MN 55442 and is currently estimated at $1,054,752, approximately $235 per square foot. 12215 60th Ave N is a home located in Hennepin County with nearby schools including Oak View Elementary School, Maple Grove Middle School, and Osseo Senior High School.
Ownership History
Date
Name
Owned For
Owner Type
Purchase Details
Closed on
Sep 13, 2021
Sold by
Palm Lawrence J and The Lawrence J Palm Revocable
Bought by
Jarvis Brent and Jarvis Lisa
Current Estimated Value
Home Financials for this Owner
Home Financials are based on the most recent Mortgage that was taken out on this home.
Original Mortgage
$788,000
Outstanding Balance
$715,951
Interest Rate
2.7%
Mortgage Type
New Conventional
Estimated Equity
$338,801
Purchase Details
Closed on
May 31, 2019
Sold by
Paln Bonnie
Bought by
The Lawrence J Palm Revocable Trust
Purchase Details
Closed on
Jan 8, 2013
Sold by
Palm Richard Alan
Bought by
Palm Gerald and Palm Bonnie
Purchase Details
Closed on
Jun 11, 2009
Sold by
Ziebarth Gerry and Ziebarth Joan
Bought by
Palm Gerald and Palm Bonnie
Purchase Details
Closed on
Jan 27, 1997
Sold by
State Bank Of Rogers
Bought by
Ziebarth Joan B
Create a Home Valuation Report for This Property
The Home Valuation Report is an in-depth analysis detailing your home's value as well as a comparison with similar homes in the area
Home Values in the Area
Average Home Value in this Area
Purchase History
| Date | Buyer | Sale Price | Title Company |
|---|---|---|---|
| Jarvis Brent | $1,065,000 | Burnet Title | |
| The Lawrence J Palm Revocable Trust | $430,000 | Edina Realty Title Inc | |
| Palm Gerald | -- | Alliance Title Llc | |
| Palm Gerald | $345,000 | -- | |
| Ziebarth Joan B | $106,000 | -- |
Source: Public Records
Mortgage History
| Date | Status | Borrower | Loan Amount |
|---|---|---|---|
| Open | Jarvis Brent | $788,000 |
Source: Public Records
Tax History Compared to Growth
Tax History
| Year | Tax Paid | Tax Assessment Tax Assessment Total Assessment is a certain percentage of the fair market value that is determined by local assessors to be the total taxable value of land and additions on the property. | Land | Improvement |
|---|---|---|---|---|
| 2024 | $11,580 | $895,400 | $148,000 | $747,400 |
| 2023 | $10,879 | $873,800 | $130,000 | $743,800 |
| 2022 | $7,191 | $824,000 | $115,000 | $709,000 |
| 2021 | $5,646 | $591,000 | $110,000 | $481,000 |
| 2020 | $5,100 | $475,000 | $100,000 | $375,000 |
| 2019 | $5,400 | $413,000 | $98,000 | $315,000 |
| 2018 | $5,004 | $398,000 | $90,000 | $308,000 |
| 2017 | $4,616 | $341,000 | $83,000 | $258,000 |
| 2016 | $4,595 | $334,000 | $81,000 | $253,000 |
| 2015 | $4,747 | $334,100 | $81,100 | $253,000 |
| 2014 | -- | $311,400 | $81,900 | $229,500 |
Source: Public Records
Map
Nearby Homes
- 12350 61st Ave N
- 11755 Bass Lake Rd
- 5825 Rosewood Ln N
- 5800 Deerwood Ln N
- 11535 57th Ave N
- 5535 Quinwood Ln N
- 5525 Quinwood Ln N
- 12083 Robin Rd
- 11245 57th Ave N
- 13100 55th Place N
- 5995 Wedgewood Ln N Unit 75
- 13445 60th Place N Unit 94
- 5955 Wedgewood Ln N Unit 71
- 13460 60th Place N Unit 117
- 10840 57th Ave N
- 10820 57th Ave N
- 11015 57th Ave N
- 10955 57th Ave N
- 6477 Deerwood Ln N
- 6450 Deerwood Ln N
- 12305 60th Ave N
- 5925 Kirkwood Ln N
- 5915 Kirkwood Ln N
- 12210 60th Ave N
- 12220 60th Ave N
- 5920 Magnolia Ln N
- 12200 60th Ave N
- 5905 Kirkwood Ln N
- 5910 Magnolia Ln N
- 12300 60th Ave N
- 5865 Kirkwood Ln N
- 5900 Magnolia Ln N
- 5920 Kirkwood Ln N
- 5940 Kirkwood Cir
- 6000 Kirkwood Ln N
- 5855 Kirkwood Ln N
- 6010 Kirkwood Ln N
- 12335 County Road 10
- 12335 Bass Lake Rd
- 12335 County Road 10