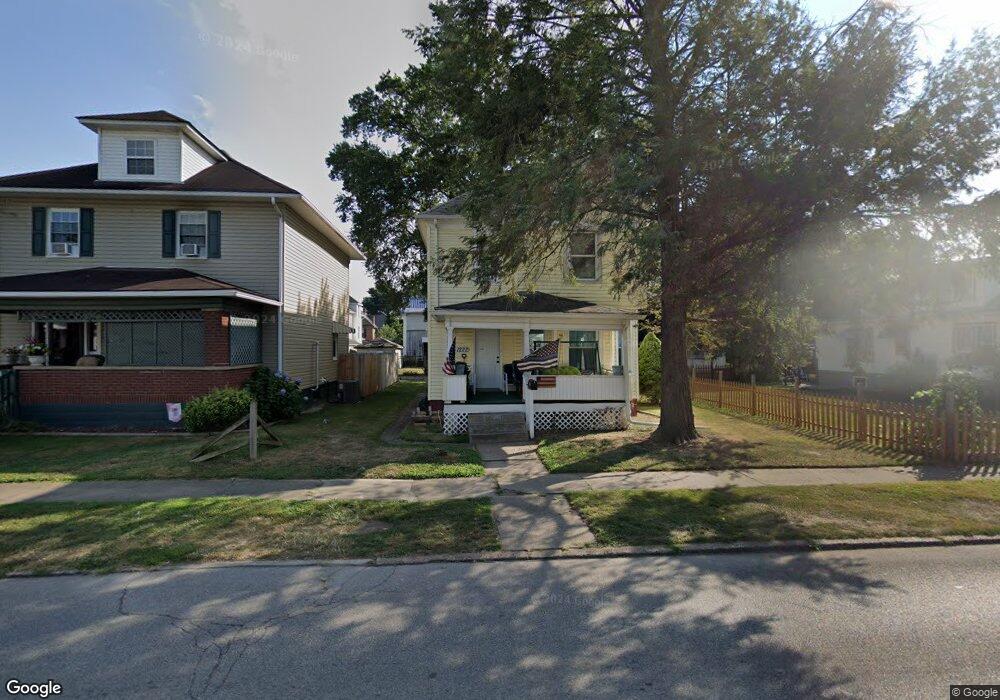
1222 23rd St Parkersburg, WV 26101
Estimated Value: $89,170 - $127,000
3
Beds
1
Bath
1,592
Sq Ft
$70/Sq Ft
Est. Value
About This Home
This home is located at 1222 23rd St, Parkersburg, WV 26101 and is currently estimated at $110,793, approximately $69 per square foot. 1222 23rd St is a home located in Wood County with nearby schools including Mckinley Elementary School, Van Devender Middle School, and Parkersburg High School.
Ownership History
Date
Name
Owned For
Owner Type
Purchase Details
Closed on
Mar 14, 2018
Sold by
Carrington Mortgage Services Llc
Bought by
Myrka Llc
Current Estimated Value
Purchase Details
Closed on
Oct 21, 2008
Sold by
Wamsley David B and Wamsley Brenda R
Bought by
Wotring Lawrence G and Wotring Cathy S
Home Financials for this Owner
Home Financials are based on the most recent Mortgage that was taken out on this home.
Original Mortgage
$59,259
Interest Rate
6.08%
Create a Home Valuation Report for This Property
The Home Valuation Report is an in-depth analysis detailing your home's value as well as a comparison with similar homes in the area
Home Values in the Area
Average Home Value in this Area
Purchase History
| Date | Buyer | Sale Price | Title Company |
|---|---|---|---|
| Myrka Llc | $25,000 | None Available | |
| Wotring Lawrence G | $54,000 | Centruy Title & Escrow Srvcs |
Source: Public Records
Mortgage History
| Date | Status | Borrower | Loan Amount |
|---|---|---|---|
| Previous Owner | Wotring Lawrence G | $59,259 |
Source: Public Records
Tax History Compared to Growth
Tax History
| Year | Tax Paid | Tax Assessment Tax Assessment Total Assessment is a certain percentage of the fair market value that is determined by local assessors to be the total taxable value of land and additions on the property. | Land | Improvement |
|---|---|---|---|---|
| 2024 | $1,306 | $39,240 | $5,460 | $33,780 |
| 2023 | $1,228 | $36,660 | $4,920 | $31,740 |
| 2022 | $1,049 | $35,460 | $4,920 | $30,540 |
| 2021 | $1,019 | $34,320 | $4,920 | $29,400 |
| 2020 | $988 | $33,180 | $4,920 | $28,260 |
| 2019 | $986 | $32,400 | $4,920 | $27,480 |
| 2018 | $495 | $31,800 | $4,920 | $26,880 |
| 2017 | $482 | $30,780 | $4,920 | $25,860 |
| 2016 | $458 | $30,960 | $6,000 | $24,960 |
| 2015 | $448 | $30,300 | $6,000 | $24,300 |
| 2014 | -- | $29,520 | $6,000 | $23,520 |
Source: Public Records
Map
Nearby Homes