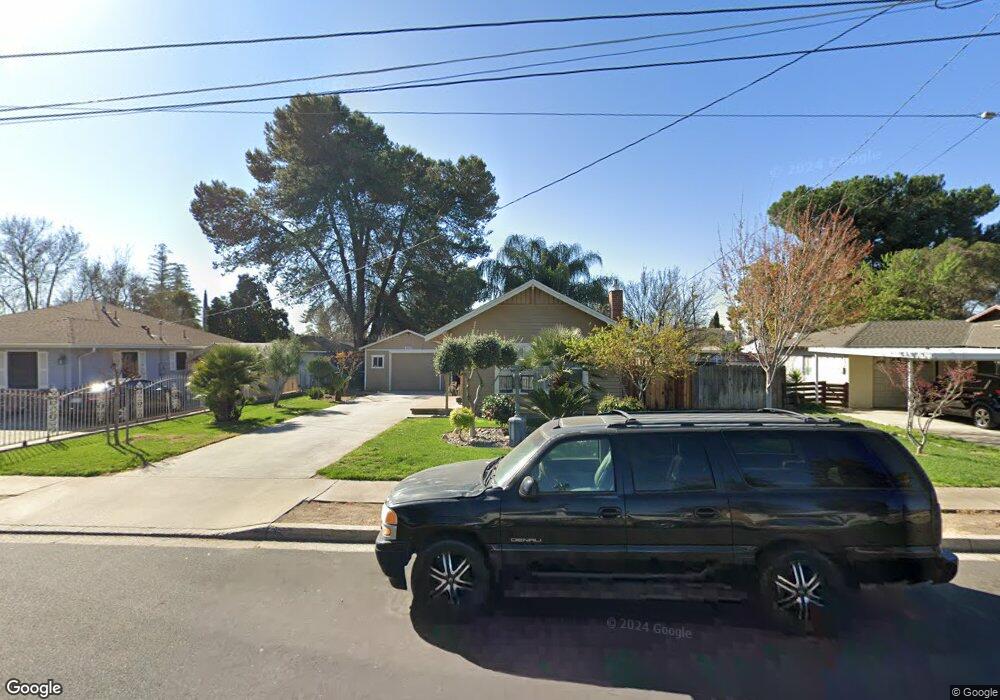
1227 Magnolia St Oakdale, CA 95361
Estimated Value: $223,000 - $320,753
2
Beds
1
Bath
920
Sq Ft
$317/Sq Ft
Est. Value
About This Home
This home is located at 1227 Magnolia St, Oakdale, CA 95361 and is currently estimated at $291,438, approximately $316 per square foot. 1227 Magnolia St is a home located in Stanislaus County with nearby schools including Magnolia Elementary School, Oakdale Junior High School, and Oakdale High School.
Ownership History
Date
Name
Owned For
Owner Type
Purchase Details
Closed on
Jul 22, 2011
Sold by
Fannie Mae
Bought by
Duarte Gonzalo and Zamudio Maria
Current Estimated Value
Purchase Details
Closed on
Apr 20, 2011
Sold by
Mabry Thaynoma Beatrice
Bought by
Federal National Mortgage Association
Purchase Details
Closed on
Mar 24, 2005
Sold by
Mabry Thaynoma Beatrice
Bought by
The Revocable Living Trust Of Thaynoma B
Home Financials for this Owner
Home Financials are based on the most recent Mortgage that was taken out on this home.
Original Mortgage
$322,500
Interest Rate
5.81%
Mortgage Type
New Conventional
Purchase Details
Closed on
Jan 25, 2005
Sold by
Mabry Thaynoma Beatrice
Bought by
Mabry Thaynoma Beatrice
Home Financials for this Owner
Home Financials are based on the most recent Mortgage that was taken out on this home.
Original Mortgage
$322,500
Interest Rate
5.81%
Mortgage Type
New Conventional
Create a Home Valuation Report for This Property
The Home Valuation Report is an in-depth analysis detailing your home's value as well as a comparison with similar homes in the area
Home Values in the Area
Average Home Value in this Area
Purchase History
| Date | Buyer | Sale Price | Title Company |
|---|---|---|---|
| Duarte Gonzalo | $49,500 | Commerce Title | |
| Federal National Mortgage Association | $100,000 | Lsi Title Company | |
| The Revocable Living Trust Of Thaynoma B | -- | -- | |
| Mabry Thaynoma Beatrice | -- | -- |
Source: Public Records
Mortgage History
| Date | Status | Borrower | Loan Amount |
|---|---|---|---|
| Previous Owner | Mabry Thaynoma Beatrice | $322,500 | |
| Closed | Mabry Thaynoma Beatrice | $322,500 |
Source: Public Records
Tax History Compared to Growth
Tax History
| Year | Tax Paid | Tax Assessment Tax Assessment Total Assessment is a certain percentage of the fair market value that is determined by local assessors to be the total taxable value of land and additions on the property. | Land | Improvement |
|---|---|---|---|---|
| 2025 | $694 | $62,159 | $50,235 | $11,924 |
| 2024 | $658 | $60,941 | $49,250 | $11,691 |
| 2023 | $644 | $59,747 | $48,285 | $11,462 |
| 2022 | $633 | $58,577 | $47,339 | $11,238 |
| 2021 | $623 | $57,429 | $46,411 | $11,018 |
| 2020 | $616 | $56,842 | $45,936 | $10,906 |
| 2019 | $606 | $55,729 | $45,036 | $10,693 |
| 2018 | $598 | $54,637 | $44,153 | $10,484 |
| 2017 | $588 | $53,567 | $43,288 | $10,279 |
| 2016 | $577 | $52,518 | $42,440 | $10,078 |
| 2015 | $570 | $51,730 | $41,803 | $9,927 |
| 2014 | $565 | $50,718 | $40,985 | $9,733 |
Source: Public Records
Map
Nearby Homes
- 166 Stanislaus Ave
- 70 Stanislaus Ave
- 140 Blankenship Ave
- 1342 Pontiac St
- 24 N Bryan Ave
- 1148 Deitz Cir
- 1105 W G St
- 827 River Pointe Cir
- 1625 Valmor Ct
- 999 River Ave
- 209 N 1st Ave
- 262 California 108
- 245 Bardo Ave
- 301 E North St
- 325 N 3rd Ave
- 325 W H St
- 1948 Sugar Pine Dr
- 1972 Sugar Pine Dr
- 0 Odessa Way Unit 225081760
- 219 S 2nd Ave
- 1219 Magnolia St
- 1237 Magnolia St
- 1218 Allen St
- 1222 Allen St
- 1253 Magnolia St
- 1234 Allen St
- 1212 Allen St
- 1159 Magnolia St
- 1244 Allen St
- 1230 Magnolia St
- 1224 Magnolia St
- 1218 Magnolia St
- 1265 Magnolia St
- 1158 Allen St
- 1149 Magnolia St
- 1214 Magnolia St
- 1240 Magnolia St
- 1164 Magnolia St
- 1150 Allen St
- 1256 Magnolia St