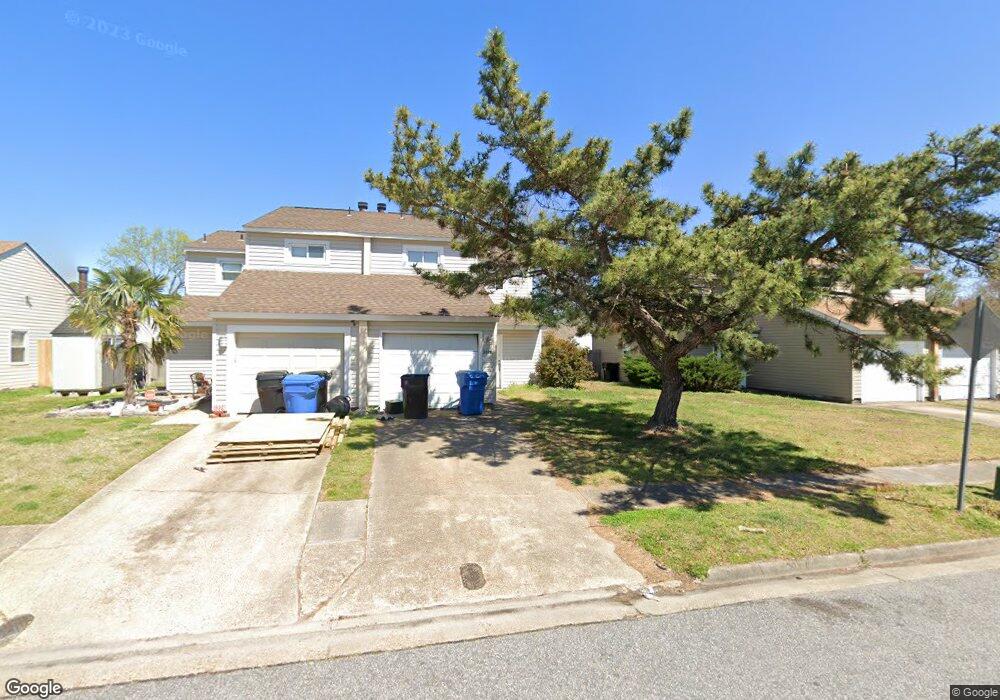
1228 Owl Ct Virginia Beach, VA 23464
Level Green NeighborhoodEstimated Value: $252,000 - $334,000
3
Beds
3
Baths
1,408
Sq Ft
$203/Sq Ft
Est. Value
About This Home
This home is located at 1228 Owl Ct, Virginia Beach, VA 23464 and is currently estimated at $285,706, approximately $202 per square foot. 1228 Owl Ct is a home located in Virginia Beach City with nearby schools including College Park Elementary School, Brandon Middle School, and Tallwood High School.
Ownership History
Date
Name
Owned For
Owner Type
Purchase Details
Closed on
Oct 20, 2021
Sold by
Robinson Anthony
Bought by
Canty Tamika Y
Current Estimated Value
Home Financials for this Owner
Home Financials are based on the most recent Mortgage that was taken out on this home.
Original Mortgage
$201,679
Outstanding Balance
$183,912
Interest Rate
2.8%
Mortgage Type
FHA
Estimated Equity
$101,794
Purchase Details
Closed on
Jun 9, 2005
Sold by
Beluga Ltd Ptnrshp
Bought by
Midgette Denise
Home Financials for this Owner
Home Financials are based on the most recent Mortgage that was taken out on this home.
Original Mortgage
$90,450
Interest Rate
5.78%
Mortgage Type
New Conventional
Purchase Details
Closed on
Nov 9, 2001
Sold by
Sec Of V A
Bought by
Beier Karl M
Home Financials for this Owner
Home Financials are based on the most recent Mortgage that was taken out on this home.
Original Mortgage
$53,280
Interest Rate
6.64%
Purchase Details
Closed on
Jan 25, 2001
Sold by
Glasser And Glasser Plc
Bought by
Sec Veterans Affairs
Create a Home Valuation Report for This Property
The Home Valuation Report is an in-depth analysis detailing your home's value as well as a comparison with similar homes in the area
Home Values in the Area
Average Home Value in this Area
Purchase History
| Date | Buyer | Sale Price | Title Company |
|---|---|---|---|
| Canty Tamika Y | $205,400 | Vintage Estate T&E | |
| Midgette Denise | $79,900 | -- | |
| Beier Karl M | $59,200 | -- | |
| Sec Veterans Affairs | $49,970 | -- |
Source: Public Records
Mortgage History
| Date | Status | Borrower | Loan Amount |
|---|---|---|---|
| Open | Canty Tamika Y | $201,679 | |
| Previous Owner | Midgette Denise | $90,450 | |
| Previous Owner | Beier Karl M | $53,280 |
Source: Public Records
Tax History Compared to Growth
Tax History
| Year | Tax Paid | Tax Assessment Tax Assessment Total Assessment is a certain percentage of the fair market value that is determined by local assessors to be the total taxable value of land and additions on the property. | Land | Improvement |
|---|---|---|---|---|
| 2025 | $2,237 | $250,300 | $85,000 | $165,300 |
| 2024 | $2,237 | $230,600 | $85,000 | $145,600 |
| 2023 | $1,997 | $201,700 | $70,000 | $131,700 |
| 2022 | $1,836 | $185,500 | $60,000 | $125,500 |
| 2021 | $1,575 | $159,100 | $49,000 | $110,100 |
| 2020 | $1,617 | $158,900 | $49,000 | $109,900 |
| 2019 | $1,563 | $154,600 | $44,000 | $110,600 |
| 2018 | $1,550 | $154,600 | $44,000 | $110,600 |
| 2017 | $1,480 | $147,600 | $44,000 | $103,600 |
| 2016 | $1,156 | $116,800 | $44,000 | $72,800 |
| 2015 | $1,124 | $113,500 | $44,000 | $69,500 |
| 2014 | $994 | $112,200 | $51,800 | $60,400 |
Source: Public Records
Map
Nearby Homes
- 1273 Clydesdale Ln
- 1213 Clydesdale Ln
- 5966 Edgelake Dr
- 5872 Connors Dr
- 1052 Lockwood Ct
- 1357 Glyndon Dr
- 1332 Drexel Cir
- 1031 Bryce Ln
- 1027 Bryce Ln
- 1066 Commonwealth Place
- 5809 Beechwalk Dr
- 1031 Commonwealth Place
- 2449 Fieldsway Dr
- 1001 Commonwealth Place
- 6415 Duquesne Place
- 1237 Jadens Way
- 6464 Duquesne Place
- 2100 Lockard Ave
- 2023 Sparrow Rd
- 1024 Josephine Crescent
- 1230 Owl Ct
- 1224 Owl Ct
- 1232 Owl Ct
- 1232 Owl Ct Unit CT
- 5984 Beechwalk Dr
- 1220 Owl Ct
- 5982 Beechwalk Dr
- 1310 Level Green Blvd
- 1218 Owl Ct
- 5986 Beechwalk Dr
- 1308 Level Green Blvd
- 5980 Beechwalk Dr
- 1219 Owl Ct
- 1216 Owl Ct
- 5988 Beechwalk Dr
- 5978 Beechwalk Dr
- 1217 Owl Ct
- 1304 Level Green Blvd
- 1214 Owl Ct
- 1215 Owl Ct