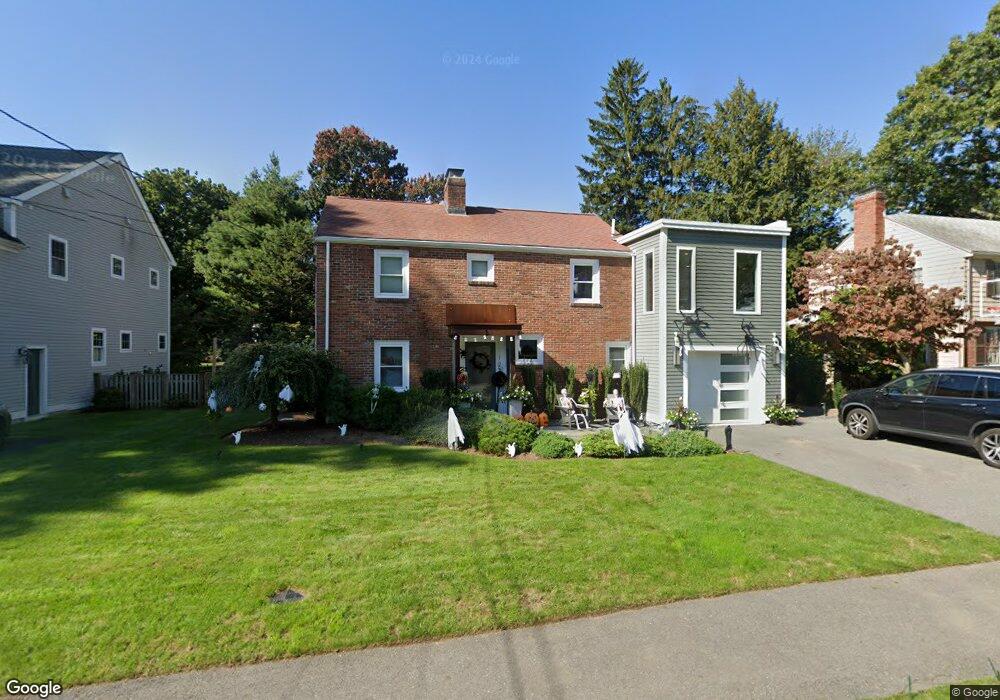
123 Manning St Needham Heights, MA 02494
Estimated Value: $1,268,000 - $1,645,598
3
Beds
2
Baths
1,640
Sq Ft
$901/Sq Ft
Est. Value
About This Home
This home is located at 123 Manning St, Needham Heights, MA 02494 and is currently estimated at $1,478,400, approximately $901 per square foot. 123 Manning St is a home located in Norfolk County with nearby schools including Mitchell Elementary School, High Rock Middle School, and Pollard Middle School.
Ownership History
Date
Name
Owned For
Owner Type
Purchase Details
Closed on
Sep 7, 2006
Sold by
Fernandez Beata B and Fernandez Richard W
Bought by
Calmes Sandra S
Current Estimated Value
Purchase Details
Closed on
Jul 12, 2002
Sold by
Baker Michael
Bought by
Fernandez Beata B and Fernandez Richard W
Purchase Details
Closed on
Jun 27, 1997
Sold by
Siegel Gary S and Siegel Deena
Bought by
Baker Michael
Create a Home Valuation Report for This Property
The Home Valuation Report is an in-depth analysis detailing your home's value as well as a comparison with similar homes in the area
Home Values in the Area
Average Home Value in this Area
Purchase History
| Date | Buyer | Sale Price | Title Company |
|---|---|---|---|
| Calmes Sandra S | $665,000 | -- | |
| Fernandez Beata B | $573,500 | -- | |
| Baker Michael | $283,000 | -- |
Source: Public Records
Mortgage History
| Date | Status | Borrower | Loan Amount |
|---|---|---|---|
| Open | Baker Michael | $20,052 | |
| Open | Baker Michael | $495,000 |
Source: Public Records
Tax History Compared to Growth
Tax History
| Year | Tax Paid | Tax Assessment Tax Assessment Total Assessment is a certain percentage of the fair market value that is determined by local assessors to be the total taxable value of land and additions on the property. | Land | Improvement |
|---|---|---|---|---|
| 2025 | $14,077 | $1,328,000 | $747,100 | $580,900 |
| 2024 | $16,427 | $1,312,100 | $533,700 | $778,400 |
| 2023 | $16,331 | $1,252,400 | $533,700 | $718,700 |
| 2022 | $15,476 | $1,157,500 | $468,100 | $689,400 |
| 2021 | $15,082 | $1,157,500 | $468,100 | $689,400 |
| 2020 | $14,269 | $1,142,400 | $468,700 | $673,700 |
| 2019 | $11,445 | $923,700 | $426,100 | $497,600 |
| 2018 | $10,905 | $917,900 | $426,100 | $491,800 |
| 2017 | $10,178 | $856,000 | $426,100 | $429,900 |
| 2016 | $9,878 | $856,000 | $426,100 | $429,900 |
| 2015 | $9,664 | $856,000 | $426,100 | $429,900 |
| 2014 | $9,328 | $801,400 | $387,300 | $414,100 |
Source: Public Records
Map
Nearby Homes
- 556 Webster St
- 190 Brookline St
- 445 Hillside Ave
- 3 Crescent Rd
- 332 Hillcrest Rd
- 40 Otis St Unit L
- 400 Hunnewell St Unit 103
- 9 Jayne Rd
- 42 Otis St Unit R
- 36 Davenport Rd
- 379 Hunnewell St Unit 379
- 62 Washington Ave
- 143 Hunting Rd
- 23 Cheney St
- 7 Avery St
- 26 Pinewood Rd
- 154 Warren St
- 34 Pershing Rd
- 35 Andrea Cir
- 71 School St
- 117 Manning St
- 129 Manning St
- 18 Homestead Park
- 24 Homestead Park
- 139 Manning St
- 118 Manning St
- 130 Manning St
- 11 Lasalle Rd
- 107 Manning St
- 22 Homestead Park
- 114 Manning St
- 15 Lasalle Rd
- 136 Manning St
- 35 Homestead Park
- 15 Homestead Park
- 108 Manning St
- 30 Homestead Park
- 21 Lasalle Rd
- 101 Manning St
- 142 Manning St