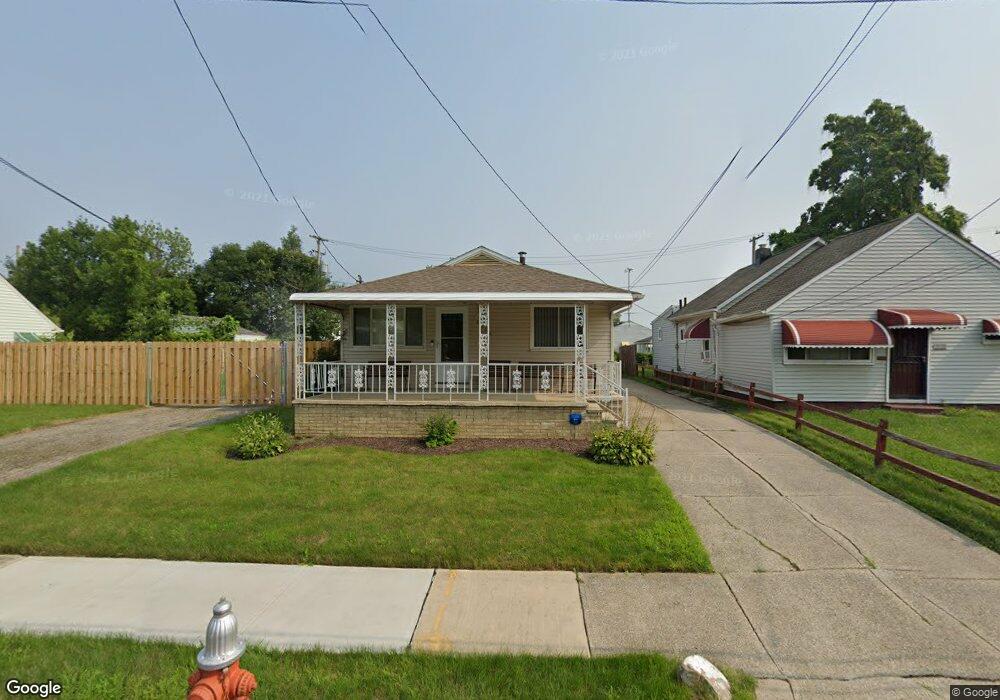
12306 Emery Ave Cleveland, OH 44135
Bellaire-Puritas NeighborhoodEstimated Value: $93,000 - $127,000
3
Beds
1
Bath
912
Sq Ft
$127/Sq Ft
Est. Value
About This Home
This home is located at 12306 Emery Ave, Cleveland, OH 44135 and is currently estimated at $115,619, approximately $126 per square foot. 12306 Emery Ave is a home located in Cuyahoga County with nearby schools including Artemus Ward School, Almira Academy, and Benjamin Franklin.
Ownership History
Date
Name
Owned For
Owner Type
Purchase Details
Closed on
Dec 11, 2015
Sold by
Williams Christopher
Bought by
Williams Emanuel
Current Estimated Value
Purchase Details
Closed on
Nov 12, 2015
Sold by
Johnson Johnny I and Johnson Celestine A
Bought by
Williams Emanuel
Purchase Details
Closed on
Nov 10, 2015
Sold by
Williams Sabrina
Bought by
Williams Emanuel
Purchase Details
Closed on
Nov 9, 2015
Sold by
Johnson Celestine A and Johnson Johnny I
Bought by
Williams Emanuel
Purchase Details
Closed on
Nov 7, 2015
Sold by
Horn Nerissa and Horn Vincent
Bought by
Williams Emanuel
Purchase Details
Closed on
Aug 19, 2015
Sold by
Estate Of Ollie Williams
Bought by
Williams Emanuel and Williams Felicia
Purchase Details
Closed on
Jun 16, 2015
Sold by
Estate Of Celestine Williams
Bought by
Williams Ollie
Purchase Details
Closed on
Jan 1, 1975
Bought by
Williams Ollie and Williams Celestine
Create a Home Valuation Report for This Property
The Home Valuation Report is an in-depth analysis detailing your home's value as well as a comparison with similar homes in the area
Home Values in the Area
Average Home Value in this Area
Purchase History
| Date | Buyer | Sale Price | Title Company |
|---|---|---|---|
| Williams Emanuel | -- | Attorney | |
| Williams Emanuel | -- | Attorney | |
| Williams Emanuel | -- | Attorney | |
| Williams Emanuel | -- | Attorney | |
| Williams Emanuel | -- | Attorney | |
| Williams Emanuel | -- | Attorney | |
| Williams Emanuel | -- | Attorney | |
| Williams Emanuel | -- | Attorney | |
| Williams Ollie | -- | Attorney | |
| Williams Ollie | -- | -- |
Source: Public Records
Tax History Compared to Growth
Tax History
| Year | Tax Paid | Tax Assessment Tax Assessment Total Assessment is a certain percentage of the fair market value that is determined by local assessors to be the total taxable value of land and additions on the property. | Land | Improvement |
|---|---|---|---|---|
| 2024 | $2,549 | $38,115 | $7,280 | $30,835 |
| 2023 | $1,403 | $18,100 | $3,120 | $14,980 |
| 2022 | $1,395 | $18,095 | $3,115 | $14,980 |
| 2021 | $1,382 | $18,100 | $3,120 | $14,980 |
| 2020 | $1,240 | $14,040 | $2,420 | $11,620 |
| 2019 | $1,149 | $40,100 | $6,900 | $33,200 |
| 2018 | $1,229 | $14,040 | $2,420 | $11,620 |
| 2017 | $1,323 | $15,650 | $2,140 | $13,510 |
| 2016 | $1,313 | $15,650 | $2,140 | $13,510 |
| 2015 | $5,547 | $15,650 | $2,140 | $13,510 |
| 2014 | $5,547 | $17,010 | $2,310 | $14,700 |
Source: Public Records
Map
Nearby Homes
- 12312 Guardian Blvd
- 12400 Saint John Ave
- 11913 Matherson Ave
- 12510 Summerland Ave
- 4059 W 130th St
- 12605 Brooklawn Ave
- 11808 Leeila Ave
- 12508 Sobieski Ave
- 12510 Grimsby Ave
- 3958 W 130th St
- 12620 Grimsby Ave
- 11909 Mortimer Ave
- 13206 Liberty Ave
- 13209 Liberty Ave
- 13301 Courtland Ave
- 11813 Kensington Ave
- 3882 W 132nd St
- 11804 Kensington Ave
- 13313 Highlandview Ave
- 3918 Brookside Blvd
- 12302 Emery Ave
- 12216 Emery Ave
- 12301 Hirst Ave
- 12233 Hirst Ave
- 12305 Hirst Ave
- 12314 Emery Ave
- 12229 Hirst Ave
- 12309 Hirst Ave
- 12208 Emery Ave
- 12305 Emery Ave
- 12402 Emery Ave
- 12225 Hirst Ave
- 12313 Hirst Ave
- 12301 Emery Ave
- 12309 Emery Ave
- 12313 Emery Ave
- 12217 Emery Ave
- 12401 Hirst Ave
- 12213 Emery Ave
- 12406 Emery Ave