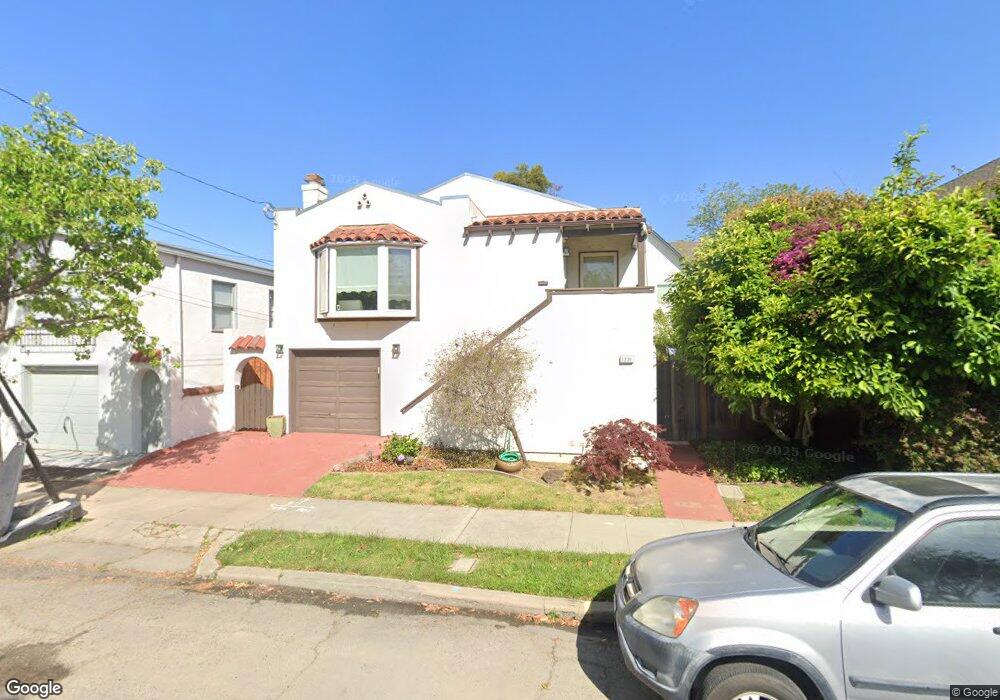
1231 Court St Alameda, CA 94501
South Shore NeighborhoodEstimated Value: $1,363,000 - $1,603,000
3
Beds
2
Baths
1,924
Sq Ft
$775/Sq Ft
Est. Value
About This Home
This home is located at 1231 Court St, Alameda, CA 94501 and is currently estimated at $1,491,454, approximately $775 per square foot. 1231 Court St is a home located in Alameda County with nearby schools including Frank Otis Elementary School, Lincoln Middle School, and Alameda High School.
Ownership History
Date
Name
Owned For
Owner Type
Purchase Details
Closed on
Jan 20, 2022
Sold by
Noonan Steven P and Noonan Marissa Y
Bought by
Fong Noonan Family Trust
Current Estimated Value
Purchase Details
Closed on
Jul 17, 2014
Sold by
Murphy Michael and Murphy Deborah
Bought by
Noonan Steven P and Fong Marissa Y
Home Financials for this Owner
Home Financials are based on the most recent Mortgage that was taken out on this home.
Original Mortgage
$540,000
Interest Rate
4.1%
Mortgage Type
New Conventional
Purchase Details
Closed on
Apr 26, 2011
Sold by
Rentmeester Andrew E and Rentmeester Frances
Bought by
Murphy Michael and Murphy Deborah
Home Financials for this Owner
Home Financials are based on the most recent Mortgage that was taken out on this home.
Original Mortgage
$560,000
Interest Rate
4.72%
Mortgage Type
New Conventional
Purchase Details
Closed on
May 1, 2008
Sold by
Rentmeester Andrew E and Rentmeester Frances
Bought by
Rentmeester Andrew E and Rentmeester Frances
Home Financials for this Owner
Home Financials are based on the most recent Mortgage that was taken out on this home.
Original Mortgage
$588,294
Interest Rate
6.11%
Mortgage Type
FHA
Purchase Details
Closed on
Apr 23, 2008
Sold by
Bartz Allen Timothy and Bartz Allen Rachel
Bought by
Rentmeester Andrew E and Rentmeester Frances
Home Financials for this Owner
Home Financials are based on the most recent Mortgage that was taken out on this home.
Original Mortgage
$588,294
Interest Rate
6.11%
Mortgage Type
FHA
Purchase Details
Closed on
Sep 6, 2006
Sold by
Ogrady Patrick and Ogrady Tina
Bought by
Bartz Allen Timothy and Bartz Allen Rachel
Home Financials for this Owner
Home Financials are based on the most recent Mortgage that was taken out on this home.
Original Mortgage
$495,000
Interest Rate
6.67%
Mortgage Type
Purchase Money Mortgage
Purchase Details
Closed on
Jan 11, 2002
Sold by
Seglund Debra
Bought by
Ogrady Patrick and Lester Tina
Home Financials for this Owner
Home Financials are based on the most recent Mortgage that was taken out on this home.
Original Mortgage
$300,700
Interest Rate
7.01%
Purchase Details
Closed on
Mar 14, 1995
Sold by
Mcgrew Myrtle M and The Olive I Hainke Trust
Bought by
Seglund Debra
Home Financials for this Owner
Home Financials are based on the most recent Mortgage that was taken out on this home.
Original Mortgage
$184,000
Interest Rate
9.03%
Create a Home Valuation Report for This Property
The Home Valuation Report is an in-depth analysis detailing your home's value as well as a comparison with similar homes in the area
Home Values in the Area
Average Home Value in this Area
Purchase History
| Date | Buyer | Sale Price | Title Company |
|---|---|---|---|
| Fong Noonan Family Trust | -- | Tseng Law Firm | |
| Noonan Steven P | $860,000 | Placer Title Company | |
| Murphy Michael | $700,000 | Placer Title Company | |
| Rentmeester Andrew E | -- | Placer Title Company | |
| Rentmeester Andrew E | $630,000 | Placer Title Company | |
| Bartz Allen Timothy | $660,000 | Alliance Title Company | |
| Ogrady Patrick | $405,000 | First American Title Guarant | |
| Seglund Debra | $230,000 | First American Title Guarant |
Source: Public Records
Mortgage History
| Date | Status | Borrower | Loan Amount |
|---|---|---|---|
| Previous Owner | Noonan Steven P | $540,000 | |
| Previous Owner | Murphy Michael | $560,000 | |
| Previous Owner | Rentmeester Andrew E | $588,294 | |
| Previous Owner | Bartz Allen Timothy | $495,000 | |
| Previous Owner | Ogrady Patrick | $300,700 | |
| Previous Owner | Seglund Debra | $184,000 | |
| Closed | Ogrady Patrick | $63,800 |
Source: Public Records
Tax History Compared to Growth
Tax History
| Year | Tax Paid | Tax Assessment Tax Assessment Total Assessment is a certain percentage of the fair market value that is determined by local assessors to be the total taxable value of land and additions on the property. | Land | Improvement |
|---|---|---|---|---|
| 2025 | $14,923 | $1,053,327 | $310,066 | $750,261 |
| 2024 | $14,923 | $1,032,541 | $303,988 | $735,553 |
| 2023 | $14,348 | $1,019,160 | $298,028 | $721,132 |
| 2022 | $14,028 | $992,178 | $292,185 | $706,993 |
| 2021 | $13,682 | $972,591 | $286,457 | $693,134 |
| 2020 | $13,517 | $969,550 | $283,521 | $686,029 |
| 2019 | $12,491 | $926,546 | $277,964 | $648,582 |
| 2018 | $12,173 | $908,383 | $272,515 | $635,868 |
| 2017 | $11,599 | $890,572 | $267,171 | $623,401 |
| 2016 | $11,626 | $873,114 | $261,934 | $611,180 |
| 2015 | $11,592 | $860,000 | $258,000 | $602,000 |
| 2014 | $9,780 | $731,583 | $219,475 | $512,108 |
Source: Public Records
Map
Nearby Homes
- 2848 San Jose Ave
- 1238 Versailles Ave
- 2839 Washington St
- 3103 Central Ave
- 3208 Washington St
- 2620 Encinal Ave
- 1210 Broadway Unit A
- 2829 Otis Dr
- 3171 Bayview Dr
- 975 Pearl St
- 3246 Garfield Ave
- 1259 Eastshore Dr
- 3114 Thompson Ave
- 3012 Bayview Dr
- 3029 Thompson Ave
- 1024 Regent St
- 2417 Marti Rae Ct
- 1100 Park Ave
- 1601 Broadway Unit 9
- 1251 Park St
- 2919 Madison St
- 2913 Madison St
- 2909 Madison St
- 3001 Madison St
- 2906 Encinal Ave
- 2905 Madison St
- 1215 Court St
- 3005 Madison St
- 1230 Mound St
- 2904 Encinal Ave
- 3004 Encinal Ave
- 2901 Madison St
- 1213 Court St
- 3007 Madison St
- 2900 Encinal Ave
- 2908 Madison St
- 3008 Encinal Ave
- 1216 Court St
- 1218 Mound St
- 1211 Court St