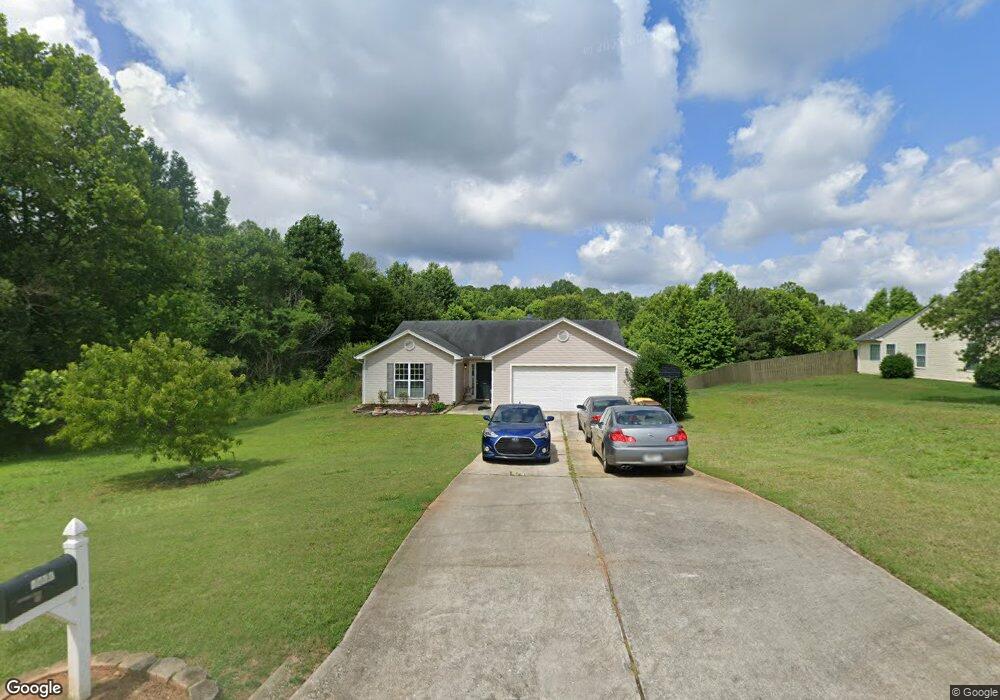
1233 Palmer Dr Winder, GA 30680
Estimated Value: $279,000 - $318,000
3
Beds
2
Baths
1,398
Sq Ft
$215/Sq Ft
Est. Value
About This Home
This home is located at 1233 Palmer Dr, Winder, GA 30680 and is currently estimated at $300,121, approximately $214 per square foot. 1233 Palmer Dr is a home located in Barrow County with nearby schools including Bethlehem Elementary School, Haymon-Morris Middle School, and Apalachee High School.
Ownership History
Date
Name
Owned For
Owner Type
Purchase Details
Closed on
Nov 14, 2024
Sold by
Emory Amanda
Bought by
Lee Jonathan
Current Estimated Value
Home Financials for this Owner
Home Financials are based on the most recent Mortgage that was taken out on this home.
Original Mortgage
$178,062
Outstanding Balance
$176,598
Interest Rate
7.12%
Mortgage Type
FHA
Estimated Equity
$123,523
Purchase Details
Closed on
Oct 24, 2005
Sold by
Southfork Hms Inc
Bought by
Emory Amanda and Lee Jonathan
Home Financials for this Owner
Home Financials are based on the most recent Mortgage that was taken out on this home.
Original Mortgage
$24,600
Interest Rate
5.34%
Mortgage Type
New Conventional
Purchase Details
Closed on
Feb 25, 2004
Sold by
Smith Mill Development Inc
Bought by
Southfork Homes Inc
Purchase Details
Closed on
Aug 20, 2002
Bought by
Smith Mill Development Inc
Create a Home Valuation Report for This Property
The Home Valuation Report is an in-depth analysis detailing your home's value as well as a comparison with similar homes in the area
Home Values in the Area
Average Home Value in this Area
Purchase History
| Date | Buyer | Sale Price | Title Company |
|---|---|---|---|
| Lee Jonathan | -- | -- | |
| Emory Amanda | $123,100 | -- | |
| Southfork Homes Inc | $35,000 | -- | |
| Smith Mill Development Inc | -- | -- |
Source: Public Records
Mortgage History
| Date | Status | Borrower | Loan Amount |
|---|---|---|---|
| Open | Lee Jonathan | $178,062 | |
| Previous Owner | Emory Amanda | $24,600 |
Source: Public Records
Tax History Compared to Growth
Tax History
| Year | Tax Paid | Tax Assessment Tax Assessment Total Assessment is a certain percentage of the fair market value that is determined by local assessors to be the total taxable value of land and additions on the property. | Land | Improvement |
|---|---|---|---|---|
| 2024 | $1,994 | $81,008 | $16,000 | $65,008 |
| 2023 | $1,587 | $81,408 | $16,000 | $65,408 |
| 2022 | $1,627 | $57,307 | $16,000 | $41,307 |
| 2021 | $1,707 | $57,307 | $16,000 | $41,307 |
| 2020 | $1,703 | $57,307 | $16,000 | $41,307 |
| 2019 | $1,731 | $57,307 | $16,000 | $41,307 |
| 2018 | $1,421 | $47,961 | $12,000 | $35,961 |
| 2017 | $1,236 | $42,456 | $12,000 | $30,456 |
| 2016 | $1,151 | $40,028 | $12,000 | $28,028 |
| 2015 | $1,165 | $40,331 | $12,000 | $28,331 |
| 2014 | $1,026 | $35,593 | $6,958 | $28,635 |
| 2013 | -- | $34,181 | $6,958 | $27,223 |
Source: Public Records
Map
Nearby Homes
- 1231 Palmer Dr
- 1235 Palmer Dr
- 1306 Palmer Dr
- 1229 Palmer Dr
- 1230 Palmer Driver (62)
- 1232 Palmer Dr
- 1230 Palmer Dr
- 1234 Palmer Dr
- 1237 Palmer Dr
- 1227 Palmer Dr
- 1228 Palmer Dr Unit 63
- 1228 Palmer Dr
- 1236 Palmer Dr
- 1303 Palmer Ln
- 1225 Palmer Dr
- 625 Palmer Ct
- 1307 Palmer Ln
- 1223 Palmer Dr
- 0 Palmer Ln
- 652 Palmer Ct