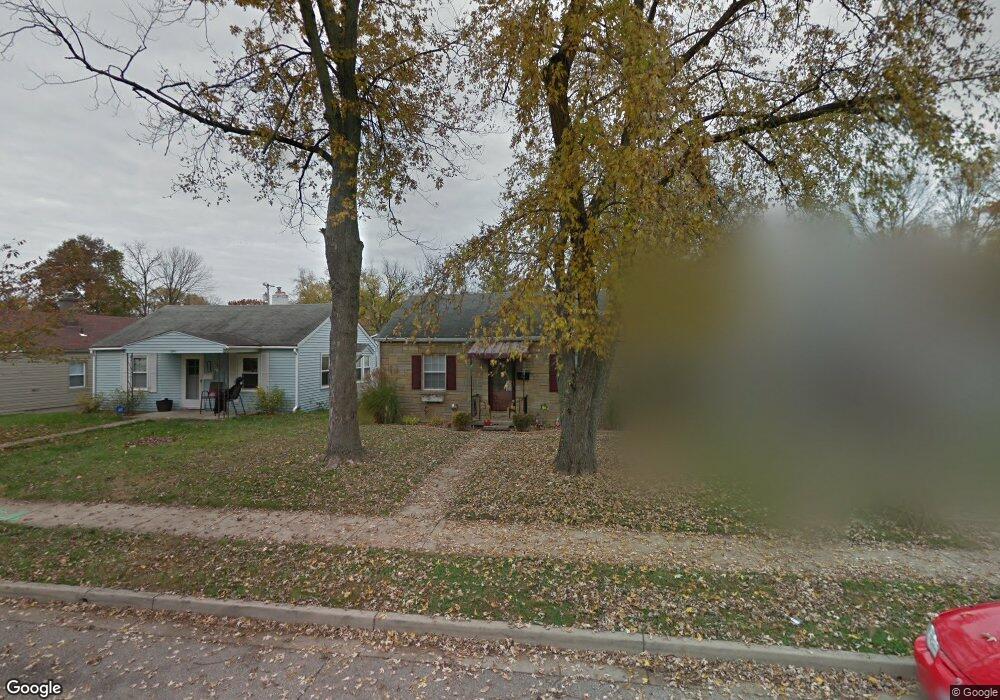
1233 Southlyn Dr Dayton, OH 45409
Estimated Value: $119,000 - $145,000
2
Beds
1
Bath
720
Sq Ft
$185/Sq Ft
Est. Value
About This Home
This home is located at 1233 Southlyn Dr, Dayton, OH 45409 and is currently estimated at $133,283, approximately $185 per square foot. 1233 Southlyn Dr is a home located in Montgomery County with nearby schools including Southdale Elementary School, Van Buren Middle School, and Kettering Fairmont High School.
Ownership History
Date
Name
Owned For
Owner Type
Purchase Details
Closed on
Jun 30, 2022
Sold by
Rtj Properties Llc
Bought by
Rakestraw-Behnken Nancy E
Current Estimated Value
Home Financials for this Owner
Home Financials are based on the most recent Mortgage that was taken out on this home.
Original Mortgage
$80,514
Outstanding Balance
$77,056
Interest Rate
5.81%
Mortgage Type
FHA
Estimated Equity
$56,227
Purchase Details
Closed on
Nov 5, 2012
Sold by
Federal Home Loan Mortgage Corporation
Bought by
Rtj Properties Llc
Purchase Details
Closed on
Aug 17, 2012
Sold by
Moore Jimmy R and Moore Sarah M
Bought by
Federal Home Loan Mortgage Corporation
Purchase Details
Closed on
Oct 1, 2003
Sold by
Walters Robert D and Walters Ann T
Bought by
Moore Jimmy R and Moore Sarah M
Home Financials for this Owner
Home Financials are based on the most recent Mortgage that was taken out on this home.
Original Mortgage
$62,828
Interest Rate
6.43%
Mortgage Type
FHA
Create a Home Valuation Report for This Property
The Home Valuation Report is an in-depth analysis detailing your home's value as well as a comparison with similar homes in the area
Home Values in the Area
Average Home Value in this Area
Purchase History
| Date | Buyer | Sale Price | Title Company |
|---|---|---|---|
| Rakestraw-Behnken Nancy E | $82,000 | Mantica Christopher J | |
| Rtj Properties Llc | $22,800 | None Available | |
| Federal Home Loan Mortgage Corporation | $34,000 | None Available | |
| Moore Jimmy R | $63,900 | -- |
Source: Public Records
Mortgage History
| Date | Status | Borrower | Loan Amount |
|---|---|---|---|
| Open | Rakestraw-Behnken Nancy E | $80,514 | |
| Previous Owner | Moore Jimmy R | $62,828 | |
| Closed | Rakestraw-Behnken Nancy E | $4,100 |
Source: Public Records
Tax History Compared to Growth
Tax History
| Year | Tax Paid | Tax Assessment Tax Assessment Total Assessment is a certain percentage of the fair market value that is determined by local assessors to be the total taxable value of land and additions on the property. | Land | Improvement |
|---|---|---|---|---|
| 2024 | $2,223 | $35,540 | $13,320 | $22,220 |
| 2023 | $2,223 | $35,540 | $13,320 | $22,220 |
| 2022 | $1,908 | $23,580 | $8,820 | $14,760 |
| 2021 | $1,769 | $23,580 | $8,820 | $14,760 |
| 2020 | $1,984 | $23,580 | $8,820 | $14,760 |
| 2019 | $2,103 | $22,270 | $8,820 | $13,450 |
| 2018 | $2,113 | $22,270 | $8,820 | $13,450 |
| 2017 | $1,968 | $22,270 | $8,820 | $13,450 |
| 2016 | $2,043 | $21,840 | $8,820 | $13,020 |
| 2015 | $1,964 | $21,840 | $8,820 | $13,020 |
| 2014 | $1,964 | $21,840 | $8,820 | $13,020 |
| 2012 | -- | $23,480 | $8,820 | $14,660 |
Source: Public Records
Map
Nearby Homes
- 1129 W Dorothy Ln
- 1364 Elmdale Dr
- 1424 Elmdale Dr
- 3060 Regent St
- 1151 Brookview Ave
- 1554 Crescent Blvd
- 1314 Ridgeview Ave
- 3225 Southdale Dr Unit 1
- 1545 Cardington Rd
- 1125 Laurelwood Rd
- 1536 Old Lane Ave
- 1597 Old Lane Ave
- 3464 Southern Blvd
- 1349 Tamerlane Rd
- 1473 Constance Ave Unit 1481
- 2467 S Dixie Dr
- 3073 Hillside Ave
- 2420 Ridgeway Rd
- 1420 Adirondack Trail
- 3720 Ridgeleigh Rd Unit D
- 1225 Southlyn Dr
- 1241 Southlyn Dr
- 1249 Southlyn Dr
- 1257 Southlyn Dr
- 1232 Elmdale Dr
- 2937 Berkley St
- 1240 Elmdale Dr
- 1224 Elmdale Dr
- 1201 Southlyn Dr
- 1265 Southlyn Dr
- 1248 Elmdale Dr
- 2929 Berkley St
- 1232 Southlyn Dr
- 1240 Southlyn Dr
- 1256 Elmdale Dr
- 1273 Southlyn Dr
- 1248 Southlyn Dr
- 2953 Berkley St
- 2925 Berkley St
- 1264 Elmdale Dr