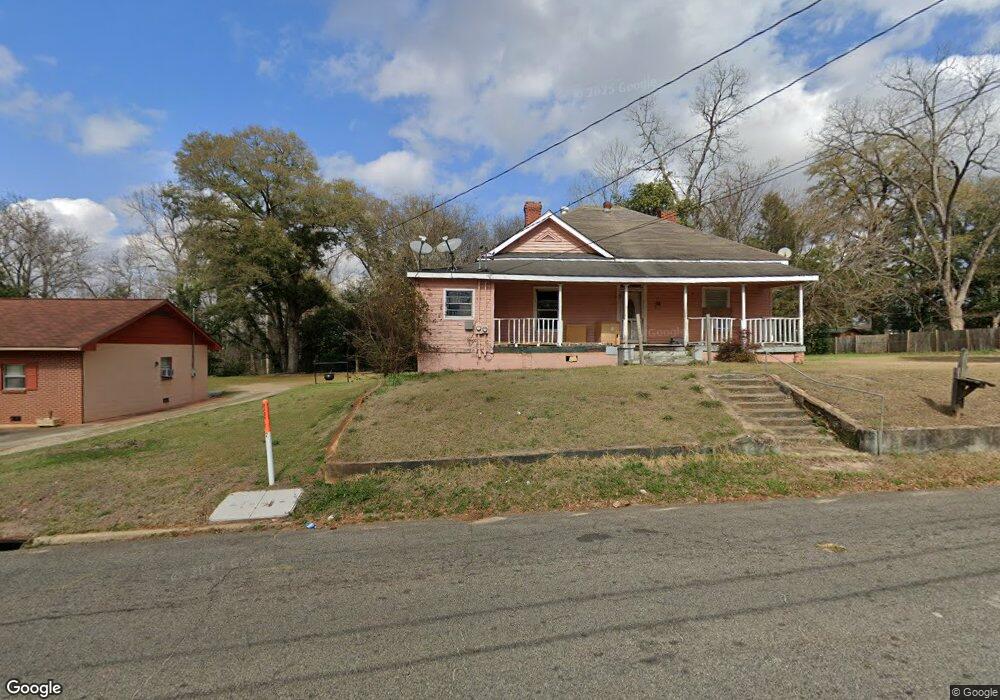
124 Ashby St Americus, GA 31709
Estimated Value: $32,543 - $175,000
3
Beds
2
Baths
1,792
Sq Ft
$57/Sq Ft
Est. Value
About This Home
This home is located at 124 Ashby St, Americus, GA 31709 and is currently estimated at $101,636, approximately $56 per square foot. 124 Ashby St is a home located in Sumter County with nearby schools including Sumter County Primary School, Sumter County Elementary School, and Sumter County Middle School.
Ownership History
Date
Name
Owned For
Owner Type
Purchase Details
Closed on
Jan 29, 2007
Sold by
Snead William Keith
Bought by
Jones Reggie
Current Estimated Value
Home Financials for this Owner
Home Financials are based on the most recent Mortgage that was taken out on this home.
Original Mortgage
$14,337
Interest Rate
6.14%
Mortgage Type
New Conventional
Purchase Details
Closed on
Apr 21, 1994
Bought by
Terry Milton
Purchase Details
Closed on
Dec 7, 1993
Bought by
Sec Hud
Purchase Details
Closed on
Jun 3, 1993
Bought by
Jackson Bobby
Purchase Details
Closed on
Sep 5, 1990
Bought by
James Bobby
Purchase Details
Closed on
Aug 1, 1987
Bought by
Sneed Tommy Lee
Purchase Details
Closed on
Mar 22, 1969
Sold by
Minyard Daisy and Minyard John
Bought by
Cain Leila
Purchase Details
Closed on
Nov 15, 1945
Sold by
Houston Chance
Bought by
Minyard John
Create a Home Valuation Report for This Property
The Home Valuation Report is an in-depth analysis detailing your home's value as well as a comparison with similar homes in the area
Home Values in the Area
Average Home Value in this Area
Purchase History
| Date | Buyer | Sale Price | Title Company |
|---|---|---|---|
| Jones Reggie | $15,500 | -- | |
| Terry Milton | $48,100 | -- | |
| Sec Hud | -- | -- | |
| Wachovia Mortage | $51,900 | -- | |
| Jackson Bobby | -- | -- | |
| James Bobby | $47,500 | -- | |
| Sneed Tommy Lee | -- | -- | |
| Cain Leila | -- | -- | |
| Minyard John | -- | -- |
Source: Public Records
Mortgage History
| Date | Status | Borrower | Loan Amount |
|---|---|---|---|
| Closed | Jones Reggie | $14,337 |
Source: Public Records
Tax History Compared to Growth
Tax History
| Year | Tax Paid | Tax Assessment Tax Assessment Total Assessment is a certain percentage of the fair market value that is determined by local assessors to be the total taxable value of land and additions on the property. | Land | Improvement |
|---|---|---|---|---|
| 2024 | $462 | $10,240 | $1,080 | $9,160 |
| 2023 | $452 | $10,240 | $1,080 | $9,160 |
| 2022 | $309 | $10,240 | $1,080 | $9,160 |
| 2021 | $453 | $10,240 | $1,080 | $9,160 |
| 2020 | $547 | $10,240 | $1,080 | $9,160 |
| 2019 | $490 | $10,240 | $1,080 | $9,160 |
| 2018 | $322 | $10,240 | $1,080 | $9,160 |
| 2017 | $322 | $10,240 | $1,080 | $9,160 |
| 2016 | $452 | $10,240 | $1,080 | $9,160 |
| 2015 | $386 | $12,600 | $1,080 | $11,520 |
| 2014 | $386 | $12,600 | $1,080 | $11,520 |
| 2013 | -- | $12,600 | $1,080 | $11,520 |
Source: Public Records
Map
Nearby Homes
- 122 Academy St
- 513 Winn St
- 333 Academy St
- 525 Ashby St
- 213 Mitchell St
- 604 A-C Ga Hwy 49s
- Lots 5 6 13 14 Hwy 49n
- 515 Eastview Dr
- 211 Horne St
- 621 E Church St
- 805 Davenport St
- 119 Carter St
- 0 Highway 30 Unit 25006222
- 406 S Hampton St
- 501 S Lee St
- 302 W College St
- 518 E Furlow St
- 0 Beale St
- 1302 Crawford St
- 624 Harrold Ave