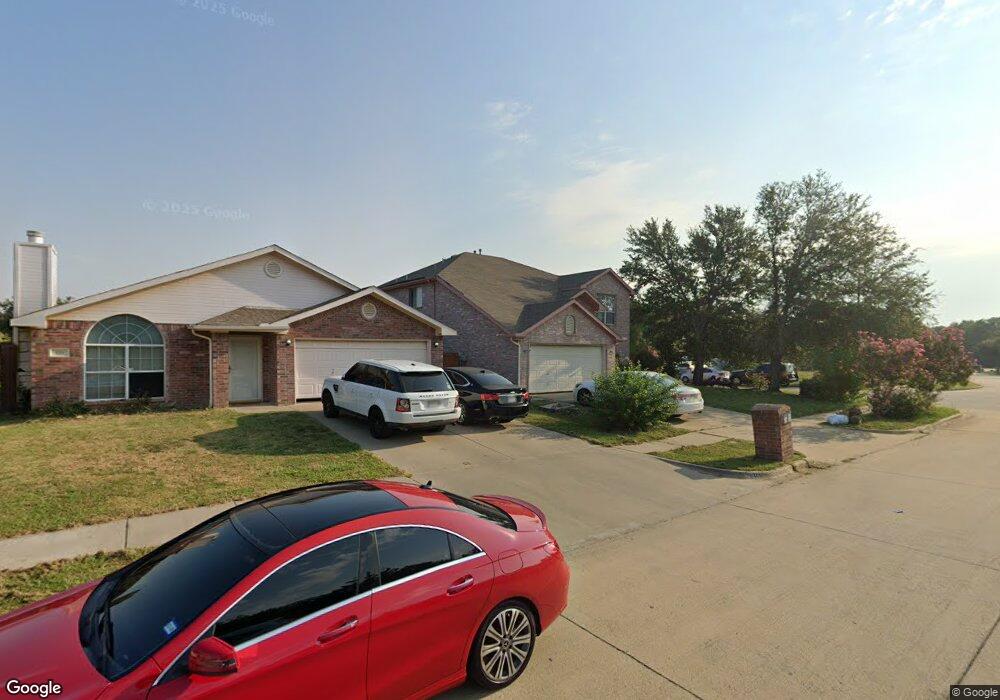
124 Enchanted Ct Grand Prairie, TX 75050
Estimated Value: $373,000 - $466,000
4
Beds
4
Baths
2,584
Sq Ft
$159/Sq Ft
Est. Value
About This Home
This home is located at 124 Enchanted Ct, Grand Prairie, TX 75050 and is currently estimated at $412,053, approximately $159 per square foot. 124 Enchanted Ct is a home located in Dallas County with nearby schools including John & Margie Stipes Elementary School, Lady Bird Johnson Middle School, and Nimitz High School.
Ownership History
Date
Name
Owned For
Owner Type
Purchase Details
Closed on
Dec 18, 2007
Sold by
Mac/Crescent #1 Llc
Bought by
Rahman Syed M and Rahman Najima
Current Estimated Value
Home Financials for this Owner
Home Financials are based on the most recent Mortgage that was taken out on this home.
Original Mortgage
$177,596
Outstanding Balance
$112,178
Interest Rate
6.26%
Mortgage Type
FHA
Estimated Equity
$299,875
Purchase Details
Closed on
Dec 4, 2007
Sold by
The Bank Of New York Trust Co Na
Bought by
Mac/Crescent #1 Llc
Home Financials for this Owner
Home Financials are based on the most recent Mortgage that was taken out on this home.
Original Mortgage
$177,596
Outstanding Balance
$112,178
Interest Rate
6.26%
Mortgage Type
FHA
Estimated Equity
$299,875
Purchase Details
Closed on
Jun 5, 2007
Sold by
Ngo Mai
Bought by
The Bank Of New York Trust Co Na and Jpmorgan Chase Bank
Purchase Details
Closed on
Jan 9, 2004
Sold by
Key Life Homes Inc
Bought by
Ngo Mai
Home Financials for this Owner
Home Financials are based on the most recent Mortgage that was taken out on this home.
Original Mortgage
$187,650
Interest Rate
6.99%
Mortgage Type
Purchase Money Mortgage
Create a Home Valuation Report for This Property
The Home Valuation Report is an in-depth analysis detailing your home's value as well as a comparison with similar homes in the area
Home Values in the Area
Average Home Value in this Area
Purchase History
| Date | Buyer | Sale Price | Title Company |
|---|---|---|---|
| Rahman Syed M | -- | None Available | |
| Mac/Crescent #1 Llc | -- | None Available | |
| The Bank Of New York Trust Co Na | $196,249 | None Available | |
| Ngo Mai | -- | -- |
Source: Public Records
Mortgage History
| Date | Status | Borrower | Loan Amount |
|---|---|---|---|
| Open | Rahman Syed M | $177,596 | |
| Previous Owner | Ngo Mai | $187,650 |
Source: Public Records
Tax History Compared to Growth
Tax History
| Year | Tax Paid | Tax Assessment Tax Assessment Total Assessment is a certain percentage of the fair market value that is determined by local assessors to be the total taxable value of land and additions on the property. | Land | Improvement |
|---|---|---|---|---|
| 2025 | $2,058 | $398,190 | $66,000 | $332,190 |
| 2024 | $2,058 | $376,630 | $60,500 | $316,130 |
| 2023 | $2,058 | $376,630 | $60,500 | $316,130 |
| 2022 | $7,273 | $305,950 | $55,000 | $250,950 |
| 2021 | $7,616 | $305,950 | $55,000 | $250,950 |
| 2020 | $7,067 | $273,410 | $44,000 | $229,410 |
| 2019 | $6,927 | $253,970 | $38,500 | $215,470 |
| 2018 | $7,005 | $253,970 | $38,500 | $215,470 |
| 2017 | $6,566 | $237,060 | $33,000 | $204,060 |
| 2016 | $4,532 | $163,630 | $33,000 | $130,630 |
| 2015 | $4,065 | $163,630 | $33,000 | $130,630 |
| 2014 | $4,065 | $163,630 | $33,000 | $130,630 |
Source: Public Records
Map
Nearby Homes
- 406 Wright Blvd
- 3329 Shivers Dr
- 3327 Shivers Dr
- 3325 Shivers Dr
- 120 Homes Dr
- 3323 Shivers Dr
- 3321 Shivers Dr
- 3319 Shivers Dr
- 124 Homes Dr
- 3317 Shivers Dr
- 126 Homes Dr
- 3311 Shivers Dr
- 3307 Shivers Dr
- 3305 Shivers Dr
- 3303 Shivers Dr
- 3301 Shivers Dr
- 3309 Shivers Dr
- 506 Piccadilly Unit 166
- 3437 Sanjeev Dr
- 1119 Carrington Ct
- 120 Enchanted Ct
- 123 Lida Ct
- 116 Enchanted Ct
- 119 Lida Ct
- 3320 Autumn View Dr
- 3324 Autumn View Dr
- 115 Lida Ct
- 3328 Autumn View Dr
- 123 Enchanted Ct
- 203 Enchanted Ct
- 112 Enchanted Ct
- 111 Lida Ct
- 3332 Autumn View Dr
- 207 Enchanted Ct
- 212 Enchanted Ct
- 115 Enchanted Ct
- 119 Enchanted Ct
- 211 Enchanted Ct
- 3336 Autumn View Dr
- 124 Lida Ct