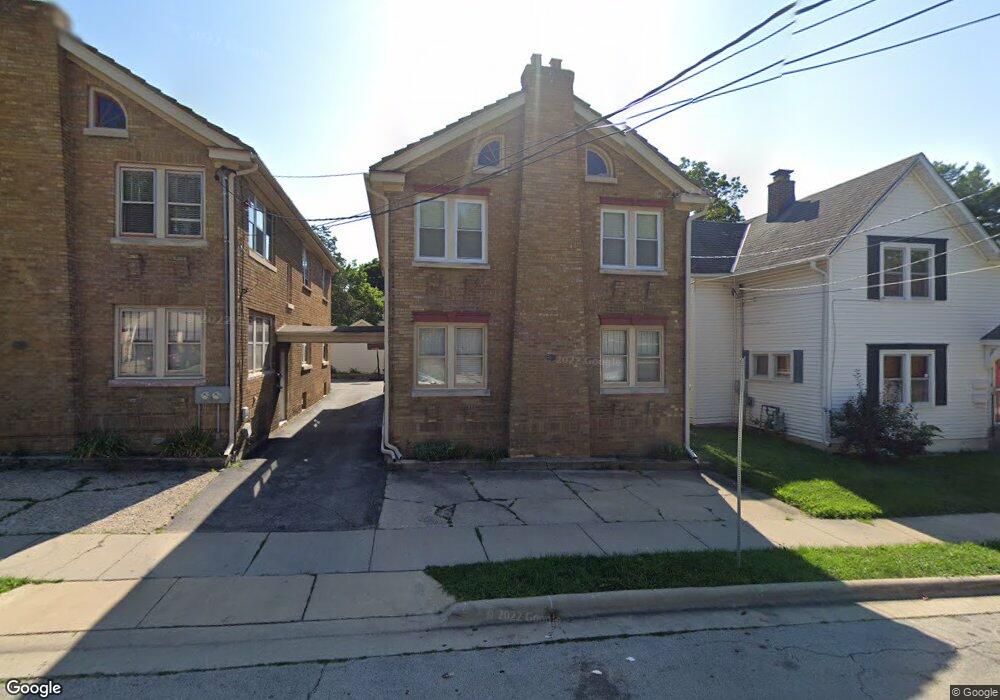
124 S Chicago Ave Rockford, IL 61104
Miracle Mile NeighborhoodEstimated Value: $147,068 - $211,000
4
Beds
4
Baths
2,400
Sq Ft
$76/Sq Ft
Est. Value
About This Home
This home is located at 124 S Chicago Ave, Rockford, IL 61104 and is currently estimated at $182,017, approximately $75 per square foot. 124 S Chicago Ave is a home located in Winnebago County with nearby schools including Maud E. Johnson Elementary School, Abraham Lincoln Middle School, and Rockford East High School.
Ownership History
Date
Name
Owned For
Owner Type
Purchase Details
Closed on
Apr 28, 2020
Sold by
Jensen Timothy J
Bought by
Seago Justin D and Seago Cristina
Current Estimated Value
Home Financials for this Owner
Home Financials are based on the most recent Mortgage that was taken out on this home.
Original Mortgage
$168,000
Outstanding Balance
$144,181
Interest Rate
3.8%
Mortgage Type
New Conventional
Estimated Equity
$37,836
Purchase Details
Closed on
Feb 1, 2018
Sold by
Judicial Sales Corporation
Bought by
Jensen Timothy J
Purchase Details
Closed on
Jan 23, 2018
Sold by
Gribble Adam L
Bought by
Jensen Timothy J
Purchase Details
Closed on
Aug 28, 2006
Bought by
Chaney Barbara
Create a Home Valuation Report for This Property
The Home Valuation Report is an in-depth analysis detailing your home's value as well as a comparison with similar homes in the area
Home Values in the Area
Average Home Value in this Area
Purchase History
| Date | Buyer | Sale Price | Title Company |
|---|---|---|---|
| Seago Justin D | $94,000 | Schlueter Ecklund & Davitt/Nn | |
| Seago Justin D | $94,000 | None Listed On Document | |
| Jensen Timothy J | $25,000 | None Listed On Document | |
| Jensen Timothy J | $25,000 | Title Underwriters Agency | |
| Jensen Timothy J | $25,000 | None Listed On Document | |
| Chaney Barbara | $112,500 | -- |
Source: Public Records
Mortgage History
| Date | Status | Borrower | Loan Amount |
|---|---|---|---|
| Open | Seago Justin D | $168,000 | |
| Closed | Seago Justin D | $168,000 |
Source: Public Records
Tax History Compared to Growth
Tax History
| Year | Tax Paid | Tax Assessment Tax Assessment Total Assessment is a certain percentage of the fair market value that is determined by local assessors to be the total taxable value of land and additions on the property. | Land | Improvement |
|---|---|---|---|---|
| 2024 | $3,160 | $33,344 | $1,715 | $31,629 |
| 2023 | $2,859 | $27,539 | $1,511 | $26,028 |
| 2022 | $2,812 | $24,615 | $1,351 | $23,264 |
| 2021 | $2,766 | $22,570 | $1,239 | $21,331 |
| 2020 | $2,743 | $21,336 | $1,171 | $20,165 |
| 2019 | $1,185 | $8,842 | $1,116 | $7,726 |
| 2018 | $1,948 | $8,333 | $1,052 | $7,281 |
| 2017 | $2,676 | $18,039 | $1,007 | $17,032 |
| 2016 | $2,674 | $17,701 | $988 | $16,713 |
| 2015 | $2,708 | $17,701 | $988 | $16,713 |
| 2014 | $2,856 | $19,200 | $1,238 | $17,962 |
Source: Public Records
Map
Nearby Homes
- 131 S Chicago Ave
- 408 S Gardiner Ave
- 224 S Prospect St
- 1822 Charles St
- 1722 Charles St
- 121 Paris Ave
- 320 Shaw St
- 206 12th St
- 1602 E State St
- 234 N Gardiner Ave
- 1921 Charles St
- 2001 Charles St
- 430 Shaw St
- 335 Saint Louis Ave
- 120 Smith Ave
- 120 Smith Ave Unit 122
- 625 16th St
- 226 Rome Ave
- 1619 Charles St
- 410 N Chicago Ave
- 122 S Chicago Ave
- 126 S Chicago Ave
- 116 S Chicago Ave
- 123 S London Ave
- 132 S Chicago Ave
- 110 S Chicago Ave Unit 110
- 127 S London Ave
- 115 S London Ave
- 123 S Chicago Ave
- 203 S London Ave
- 127 S Chicago Ave
- 111 S London Ave
- 210 S Chicago Ave
- 119 S Chicago Ave
- 205 S London Ave
- 133 S Chicago Ave
- 133 S Chicago Ave Unit 2
- 133 S Chicago Ave Unit 1
- 112 S Chicago Ave
- 1911 E State St