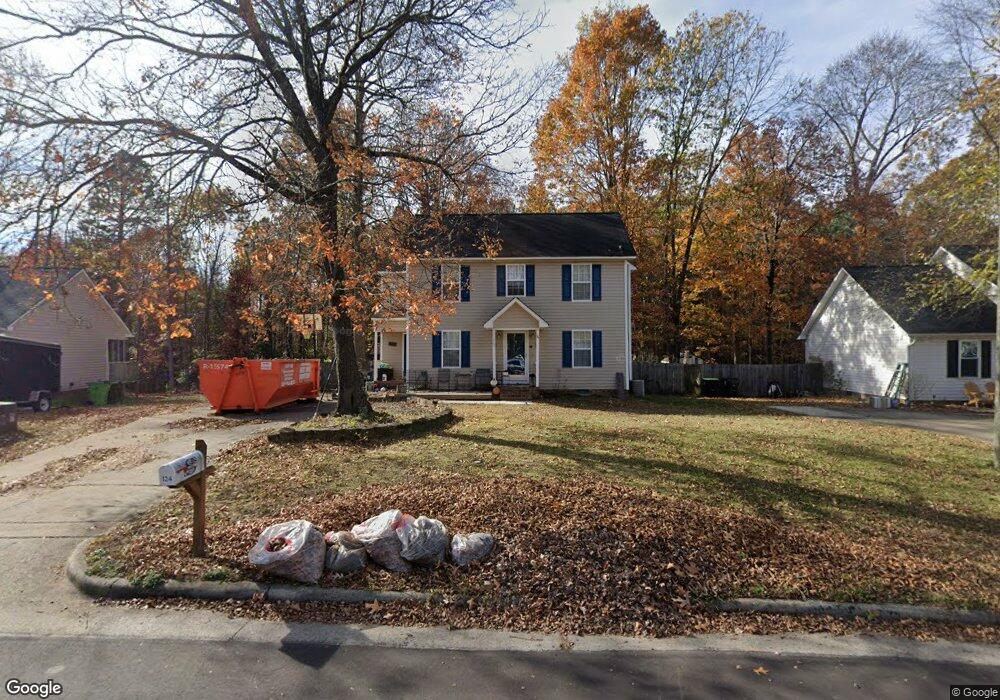
124 Saint Johns St Knightdale, NC 27545
Estimated Value: $313,000 - $333,000
3
Beds
3
Baths
1,508
Sq Ft
$214/Sq Ft
Est. Value
About This Home
This home is located at 124 Saint Johns St, Knightdale, NC 27545 and is currently estimated at $321,983, approximately $213 per square foot. 124 Saint Johns St is a home located in Wake County with nearby schools including Knightdale Elementary School, Neuse River Middle School, and Knightdale High.
Ownership History
Date
Name
Owned For
Owner Type
Purchase Details
Closed on
May 15, 2014
Sold by
Sasser Vanessa B and Sasser David E
Bought by
Suite Tyler M and Suite Danielle B
Current Estimated Value
Purchase Details
Closed on
Apr 6, 2011
Sold by
Withrow Brian and Reeder Vanessa B
Bought by
Reeder Vanessa B
Purchase Details
Closed on
Jun 6, 2008
Sold by
Miosi Michael L and Miosi Kristina J
Bought by
Withrow Brian and Reeder Vanessa B
Home Financials for this Owner
Home Financials are based on the most recent Mortgage that was taken out on this home.
Original Mortgage
$146,599
Interest Rate
6.04%
Mortgage Type
FHA
Purchase Details
Closed on
Jul 25, 2002
Sold by
Spectrum Homes Inc
Bought by
Miosi Michael L and Miosi Kristina J
Home Financials for this Owner
Home Financials are based on the most recent Mortgage that was taken out on this home.
Original Mortgage
$128,287
Interest Rate
6.67%
Mortgage Type
FHA
Create a Home Valuation Report for This Property
The Home Valuation Report is an in-depth analysis detailing your home's value as well as a comparison with similar homes in the area
Home Values in the Area
Average Home Value in this Area
Purchase History
| Date | Buyer | Sale Price | Title Company |
|---|---|---|---|
| Suite Tyler M | $150,500 | None Available | |
| Reeder Vanessa B | -- | None Available | |
| Withrow Brian | $149,000 | None Available | |
| Miosi Michael L | $130,000 | -- |
Source: Public Records
Mortgage History
| Date | Status | Borrower | Loan Amount |
|---|---|---|---|
| Previous Owner | Withrow Brian | $146,599 | |
| Previous Owner | Miosi Michael L | $128,287 |
Source: Public Records
Tax History Compared to Growth
Tax History
| Year | Tax Paid | Tax Assessment Tax Assessment Total Assessment is a certain percentage of the fair market value that is determined by local assessors to be the total taxable value of land and additions on the property. | Land | Improvement |
|---|---|---|---|---|
| 2025 | $3,136 | $325,534 | $85,000 | $240,534 |
| 2024 | $3,124 | $325,534 | $85,000 | $240,534 |
| 2023 | $2,201 | $197,057 | $38,000 | $159,057 |
| 2022 | $2,128 | $197,057 | $38,000 | $159,057 |
| 2021 | $2,030 | $197,057 | $38,000 | $159,057 |
| 2020 | $2,030 | $197,057 | $38,000 | $159,057 |
| 2019 | $1,818 | $156,286 | $38,000 | $118,286 |
| 2018 | $1,715 | $156,286 | $38,000 | $118,286 |
| 2017 | $1,653 | $156,286 | $38,000 | $118,286 |
| 2016 | $1,631 | $156,286 | $38,000 | $118,286 |
| 2015 | $1,669 | $157,876 | $37,000 | $120,876 |
| 2014 | $1,611 | $157,876 | $37,000 | $120,876 |
Source: Public Records
Map
Nearby Homes
- 104 Saint Johns St
- 619 Laurens Way
- 302 Brakeman St
- 612 Crosstie St
- 102 Switchback St
- 216 Walbury Dr
- 413 Laurens Way
- 1442 Jay Rd
- 1452 Jay Rd
- 1500 Wader Cir
- 1456 Jay Rd
- 1516 Wader Cir
- 1463 Jay Rd
- 1448 Jay Rd
- 1700 Goldfinch Perch Ln
- 1580 Goldfinch Perch Ln
- 444 Haywood Glen Dr
- 1512 Wader Cir
- 1466 Jay Rd
- 1504 Wader Cir
- 124 St Johns St
- 124 Saint Johns St
- 122 St Johns St
- 126 Saint Johns St
- 122 Saint Johns St
- 120 St Johns St
- 120 Saint Johns St
- 128 Saint Johns St
- 128 St Johns St
- 125 Saint Johns St
- 121 Saint Johns St
- 127 St John St
- 127 St Johns St
- 127 Saint Johns St
- 119 St Johns St
- 118 St Johns St
- 118 Saint Johns St
- 130 Saint Johns St
- 119 Saint Johns St
- 129 Saint Johns St