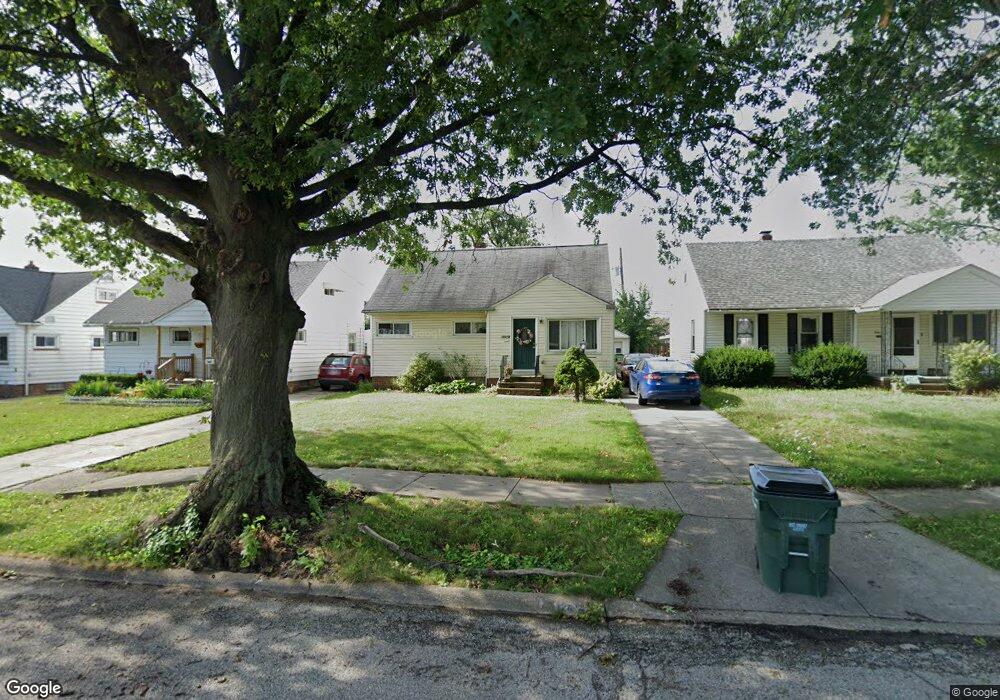
12414 Woodward Blvd Cleveland, OH 44125
Estimated Value: $125,000 - $158,000
3
Beds
1
Bath
1,030
Sq Ft
$137/Sq Ft
Est. Value
About This Home
This home is located at 12414 Woodward Blvd, Cleveland, OH 44125 and is currently estimated at $141,157, approximately $137 per square foot. 12414 Woodward Blvd is a home located in Cuyahoga County with nearby schools including Garfield Heights High School, North Shore High School, and St Benedict Catholic School.
Ownership History
Date
Name
Owned For
Owner Type
Purchase Details
Closed on
Jun 27, 2001
Sold by
Cipriano Patricia
Bought by
Hine Rick C and Hine Darlene M
Current Estimated Value
Purchase Details
Closed on
Jul 22, 1998
Sold by
Davis Patricia E and Cipriano Patricia
Bought by
Cipriano Patricia
Home Financials for this Owner
Home Financials are based on the most recent Mortgage that was taken out on this home.
Original Mortgage
$71,250
Interest Rate
7.13%
Purchase Details
Closed on
Jul 25, 1990
Sold by
Stone Eugene
Bought by
Davis Douglas J
Purchase Details
Closed on
Feb 6, 1990
Sold by
Stone Eugene
Bought by
Stone Eugene
Purchase Details
Closed on
Oct 10, 1980
Sold by
Orlik Philli J
Bought by
Stone Eugene
Purchase Details
Closed on
Jan 16, 1980
Sold by
Oros Wm and R A
Bought by
Orlik Philli J
Purchase Details
Closed on
Jan 1, 1975
Bought by
Oros Wm and R A
Create a Home Valuation Report for This Property
The Home Valuation Report is an in-depth analysis detailing your home's value as well as a comparison with similar homes in the area
Home Values in the Area
Average Home Value in this Area
Purchase History
| Date | Buyer | Sale Price | Title Company |
|---|---|---|---|
| Hine Rick C | $96,000 | Barristers Title Agency Inc | |
| Cipriano Patricia | -- | Tower City Title Agency Inc | |
| Davis Douglas J | $54,000 | -- | |
| Stone Eugene | -- | -- | |
| Stone Eugene | $53,900 | -- | |
| Orlik Philli J | $49,800 | -- | |
| Oros Wm | -- | -- |
Source: Public Records
Mortgage History
| Date | Status | Borrower | Loan Amount |
|---|---|---|---|
| Previous Owner | Cipriano Patricia | $71,250 |
Source: Public Records
Tax History Compared to Growth
Tax History
| Year | Tax Paid | Tax Assessment Tax Assessment Total Assessment is a certain percentage of the fair market value that is determined by local assessors to be the total taxable value of land and additions on the property. | Land | Improvement |
|---|---|---|---|---|
| 2024 | $4,178 | $40,845 | $8,470 | $32,375 |
| 2023 | $3,071 | $27,480 | $6,090 | $21,390 |
| 2022 | $3,025 | $27,480 | $6,090 | $21,390 |
| 2021 | $3,196 | $27,480 | $6,090 | $21,390 |
| 2020 | $2,749 | $21,980 | $4,870 | $17,120 |
| 2019 | $2,725 | $62,800 | $13,900 | $48,900 |
| 2018 | $2,726 | $21,980 | $4,870 | $17,120 |
| 2017 | $2,749 | $20,830 | $4,060 | $16,770 |
| 2016 | $2,789 | $20,830 | $4,060 | $16,770 |
| 2015 | $2,680 | $20,830 | $4,060 | $16,770 |
| 2014 | $2,680 | $21,910 | $4,270 | $17,640 |
Source: Public Records
Map
Nearby Homes
- 12324 Oak Park Blvd
- 12214 Woodward Blvd
- 12813 Oak Park Blvd
- 12313 Eastwood Blvd
- 13012 Oak Park Blvd
- 13009 Oak Park Blvd
- 12913 Darlington Ave
- 13206 Shady Oak Blvd
- 13300 Shady Oak Blvd
- 13402 Shady Oak Blvd
- 11808 Fordham Rd
- 12512 York Blvd
- 5584 Turney Rd
- 12911 Bangor Ave
- 5781 Turney Rd
- 11813 Willard Ave
- 5392 E 131st St
- 12912 Thraves Rd
- 13405 York Blvd
- 5368 E 129th St
- 12418 Woodward Blvd
- 12408 Woodward Blvd
- 12404 Woodward Blvd
- 12422 Woodward Blvd
- 12609 Eastwood Blvd
- 12613 Eastwood Blvd
- 12605 Eastwood Blvd
- 12426 Woodward Blvd
- 12400 Woodward Blvd
- 12601 Eastwood Blvd
- 12617 Eastwood Blvd
- 12419 Woodward Blvd
- 12415 Woodward Blvd
- 12423 Woodward Blvd
- 12600 Woodward Blvd
- 12328 Woodward Blvd
- 12621 Eastwood Blvd
- 12517 Eastwood Blvd
- 12409 Woodward Blvd
- 12427 Woodward Blvd