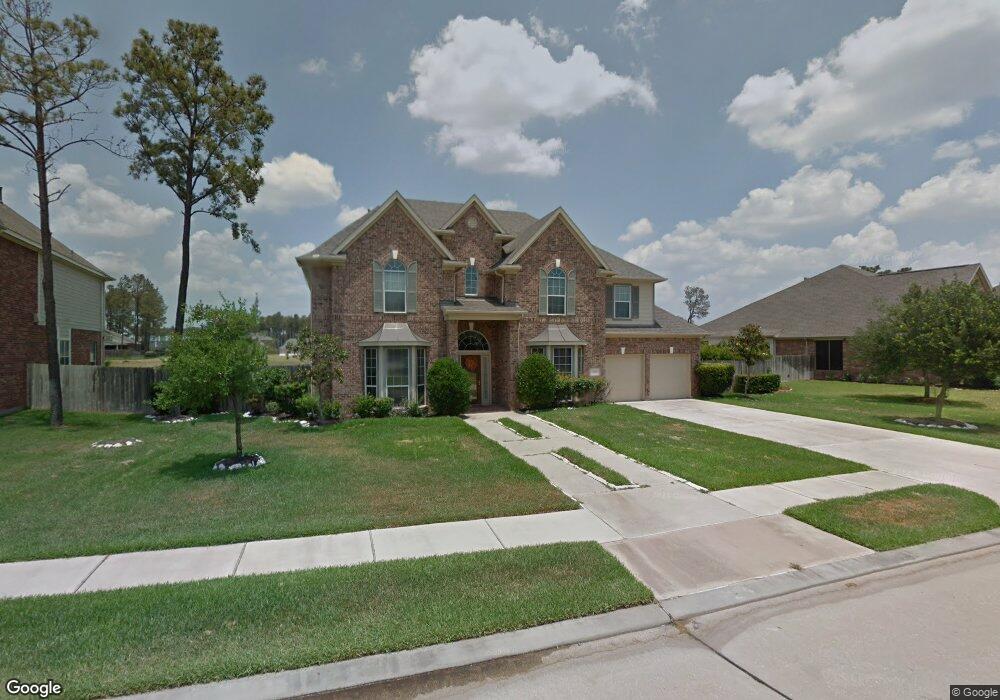
12418 Northpointe Bend Dr Tomball, TX 77377
Northpointe NeighborhoodEstimated Value: $390,000 - $634,000
4
Beds
3
Baths
2,423
Sq Ft
$233/Sq Ft
Est. Value
About This Home
This home is located at 12418 Northpointe Bend Dr, Tomball, TX 77377 and is currently estimated at $564,909, approximately $233 per square foot. 12418 Northpointe Bend Dr is a home located in Harris County with nearby schools including Canyon Pointe Elementary School, Oakcrest Intermediate School, and Tomball Memorial High School.
Ownership History
Date
Name
Owned For
Owner Type
Purchase Details
Closed on
Jul 13, 2009
Sold by
Hsbc Bank Usa Na
Bought by
Zeng Qiang and Liu Liming
Current Estimated Value
Home Financials for this Owner
Home Financials are based on the most recent Mortgage that was taken out on this home.
Original Mortgage
$225,400
Interest Rate
5.19%
Mortgage Type
Purchase Money Mortgage
Purchase Details
Closed on
May 5, 2009
Sold by
Hussain Agha Tariq and Tariq Rukhsana A
Bought by
Hsbc Bank Usa Na
Purchase Details
Closed on
Dec 5, 2005
Sold by
D R Horton Emerald Ltd
Bought by
Hussain Agha Tariq and Tariq Rukhsana A
Home Financials for this Owner
Home Financials are based on the most recent Mortgage that was taken out on this home.
Original Mortgage
$285,600
Interest Rate
6.12%
Mortgage Type
Purchase Money Mortgage
Purchase Details
Closed on
Jul 17, 2002
Sold by
Blue Ridge Partners Ltd
Bought by
D R Horton Emerald Ltd
Create a Home Valuation Report for This Property
The Home Valuation Report is an in-depth analysis detailing your home's value as well as a comparison with similar homes in the area
Home Values in the Area
Average Home Value in this Area
Purchase History
| Date | Buyer | Sale Price | Title Company |
|---|---|---|---|
| Zeng Qiang | -- | Etc | |
| Hsbc Bank Usa Na | $268,161 | None Available | |
| Hussain Agha Tariq | -- | Dhi Title | |
| D R Horton Emerald Ltd | -- | Principal Title Co Ltd |
Source: Public Records
Mortgage History
| Date | Status | Borrower | Loan Amount |
|---|---|---|---|
| Closed | Zeng Qiang | $225,400 | |
| Previous Owner | Hussain Agha Tariq | $285,600 |
Source: Public Records
Tax History Compared to Growth
Tax History
| Year | Tax Paid | Tax Assessment Tax Assessment Total Assessment is a certain percentage of the fair market value that is determined by local assessors to be the total taxable value of land and additions on the property. | Land | Improvement |
|---|---|---|---|---|
| 2025 | $12,598 | $581,006 | $124,598 | $456,408 |
| 2024 | $12,598 | $581,006 | $124,598 | $456,408 |
| 2023 | $12,598 | $662,825 | $124,598 | $538,227 |
| 2022 | $12,718 | $580,163 | $106,978 | $473,185 |
| 2021 | $12,074 | $431,775 | $81,807 | $349,968 |
| 2020 | $11,887 | $405,873 | $81,807 | $324,066 |
| 2019 | $11,828 | $392,481 | $64,187 | $328,294 |
| 2018 | $4,799 | $383,101 | $64,187 | $318,914 |
| 2017 | $10,685 | $350,000 | $64,187 | $285,813 |
| 2016 | $10,685 | $350,000 | $64,187 | $285,813 |
| 2015 | $9,198 | $350,000 | $64,187 | $285,813 |
| 2014 | $9,198 | $295,000 | $64,187 | $230,813 |
Source: Public Records
Map
Nearby Homes
- 18903 Danbridge Ct
- 18814 Emery Meadows Ln
- 12610 Baldwin Springs Ct
- 12414 Montebello Manor Ln
- 12427 Point Arbor Ct
- 18703 Summercliff Ln
- 12719 Rocky Briar Ln
- 18803 Dusty Rose Ln
- 19114 Canyon Vista Ct
- 12623 Ember Village Ln
- 19006 Rustling Ridge Ln
- 19026 Rustling Ridge Ln
- 18522 Cascade Timbers Ln
- 18135 Gravenhurst Ln
- 12022 Canyon Star Ln
- 12006 Canyon Star Ln
- 18603 Bridle Grove Ct
- 19010 Canyon Star Ct
- 18402 Sierra Falls Ct
- 14111 Boudreaux Rd
- 12422 Northpointe Bend Dr
- 12414 Northpointe Bend Dr
- 18814 Fortrose Garden Ct
- 12410 Northpointe Bend Dr
- 18819 Fortrose Garden Ct
- 18815 Oxley Ct
- 18815 Fortrose Garden Ct
- 12406 Northpointe Bend Dr
- 18811 Oxley Ct
- 18811 Fortrose Garden Ct
- 12435 Northpointe Bend Dr
- 18814 Flaghorne Ct
- 18915 Emery Meadows Ln
- 18902 Manor Spring Ct
- 18810 Flaghorne Ct
- 18814 Oxley Ct
- 18806 Fortrose Garden Ct
- 18919 Emery Meadows Ln
- 12402 Northpointe Bend Dr
- 12423 Northpointe Bend Dr