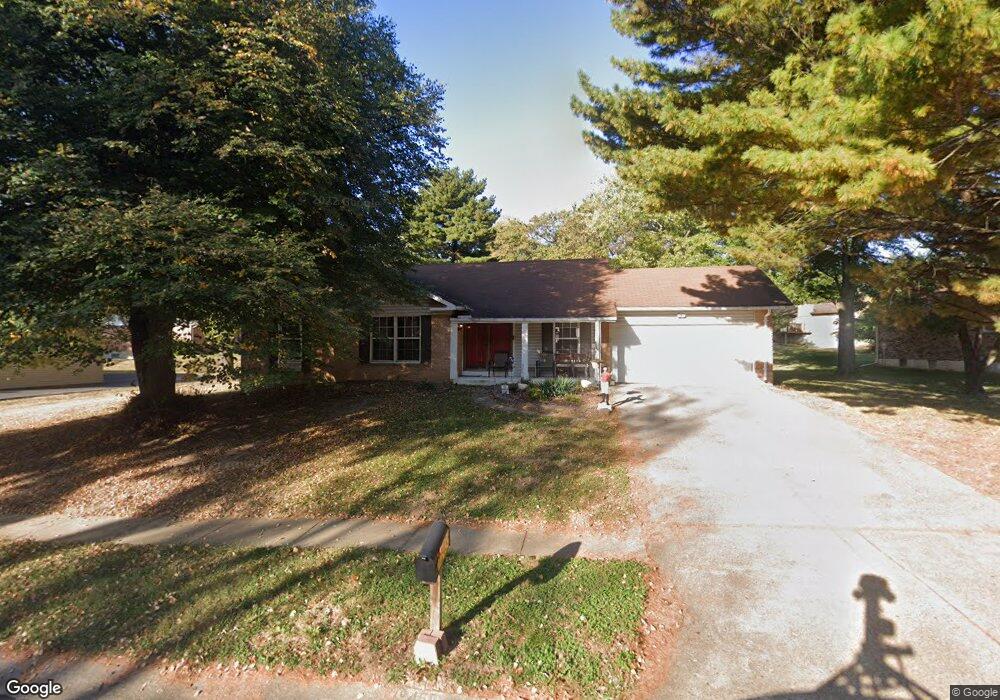
12455 Rocket Dr Florissant, MO 63033
Estimated Value: $212,080 - $250,000
4
Beds
2
Baths
2,030
Sq Ft
$115/Sq Ft
Est. Value
About This Home
This home is located at 12455 Rocket Dr, Florissant, MO 63033 and is currently estimated at $233,520, approximately $115 per square foot. 12455 Rocket Dr is a home located in St. Louis County with nearby schools including Townsend Elementary School, Central Middle School, and Hazelwood Central High School.
Ownership History
Date
Name
Owned For
Owner Type
Purchase Details
Closed on
Dec 27, 2006
Sold by
Kassa Tessema and Gbereyohnaes Tesga
Bought by
Eason Mark J and Eason Tidia R
Current Estimated Value
Home Financials for this Owner
Home Financials are based on the most recent Mortgage that was taken out on this home.
Original Mortgage
$165,000
Interest Rate
6.1%
Mortgage Type
Purchase Money Mortgage
Purchase Details
Closed on
Apr 4, 2006
Sold by
Wells Fargo Financial Missouri Inc
Bought by
Kassa Tessema and Gbereyohnaes Tesga
Home Financials for this Owner
Home Financials are based on the most recent Mortgage that was taken out on this home.
Original Mortgage
$120,000
Interest Rate
8.89%
Mortgage Type
Fannie Mae Freddie Mac
Purchase Details
Closed on
Sep 15, 2005
Sold by
Stevenson Jesseye S
Bought by
Wells Fargo Financial Missouri Inc
Create a Home Valuation Report for This Property
The Home Valuation Report is an in-depth analysis detailing your home's value as well as a comparison with similar homes in the area
Home Values in the Area
Average Home Value in this Area
Purchase History
| Date | Buyer | Sale Price | Title Company |
|---|---|---|---|
| Eason Mark J | $165,000 | None Available | |
| Kassa Tessema | $120,000 | Ctc | |
| Wells Fargo Financial Missouri Inc | $139,000 | -- |
Source: Public Records
Mortgage History
| Date | Status | Borrower | Loan Amount |
|---|---|---|---|
| Previous Owner | Eason Mark J | $165,000 | |
| Previous Owner | Kassa Tessema | $120,000 |
Source: Public Records
Tax History Compared to Growth
Tax History
| Year | Tax Paid | Tax Assessment Tax Assessment Total Assessment is a certain percentage of the fair market value that is determined by local assessors to be the total taxable value of land and additions on the property. | Land | Improvement |
|---|---|---|---|---|
| 2025 | $3,158 | $38,950 | $4,350 | $34,600 |
| 2024 | $3,158 | $34,710 | $3,400 | $31,310 |
| 2023 | $3,147 | $34,710 | $3,400 | $31,310 |
| 2022 | $2,933 | $28,760 | $7,560 | $21,200 |
| 2021 | $2,776 | $28,760 | $7,560 | $21,200 |
| 2020 | $2,811 | $27,130 | $6,630 | $20,500 |
| 2019 | $2,765 | $27,130 | $6,630 | $20,500 |
| 2018 | $2,486 | $22,530 | $3,800 | $18,730 |
| 2017 | $2,484 | $22,530 | $3,800 | $18,730 |
| 2016 | $2,800 | $25,020 | $3,400 | $21,620 |
| 2015 | $2,736 | $25,020 | $3,400 | $21,620 |
| 2014 | $2,414 | $21,950 | $4,050 | $17,900 |
Source: Public Records
Map
Nearby Homes
- 12320 Missile Ln
- 6480 Hadden Bay Dr
- 6320 Hadden Bay Dr
- 6587 Dolphin Cir E Unit 110B
- 6595 Dolphin Cir E Unit 131A
- 6250 Pennyrich Ct
- 12136 La Padera Ln
- 12225 Tarpon Dr
- 6470 White Cap Ln Unit D
- 12455 Jerries Ln
- 12292 Jerries Ln
- 12095 El Camara Dr
- 12750 Needle Point Ct
- 12065 El Camara Dr
- 12705 Stubwood Dr
- 5432 Trailbend Dr
- 12435 Sea Lane Dr Unit 5
- 12456 Sea Lane Dr Unit A
- 5348 Trailoaks Dr
- 5372 Trailbend Dr
- 12465 Rocket Dr
- 12405 Rocket Dr
- 6225 Satellite Dr
- 6342 Sandycreek Dr
- 12450 Rocket Dr
- 6444 Tide Water Dr
- 6322 Sandycreek Dr
- 6185 Satellite Dr
- 12400 Rocket Dr
- 6433 Tide Water Dr
- 6443 Tide Water Dr
- 12390 Rocket Dr
- 6454 Tide Water Dr
- 6302 Sandycreek Dr
- 12380 Missile Ln
- 6165 Satellite Dr
- 12385 Rocket Dr
- 6423 Tide Water Dr
- 6473 Tide Water Dr