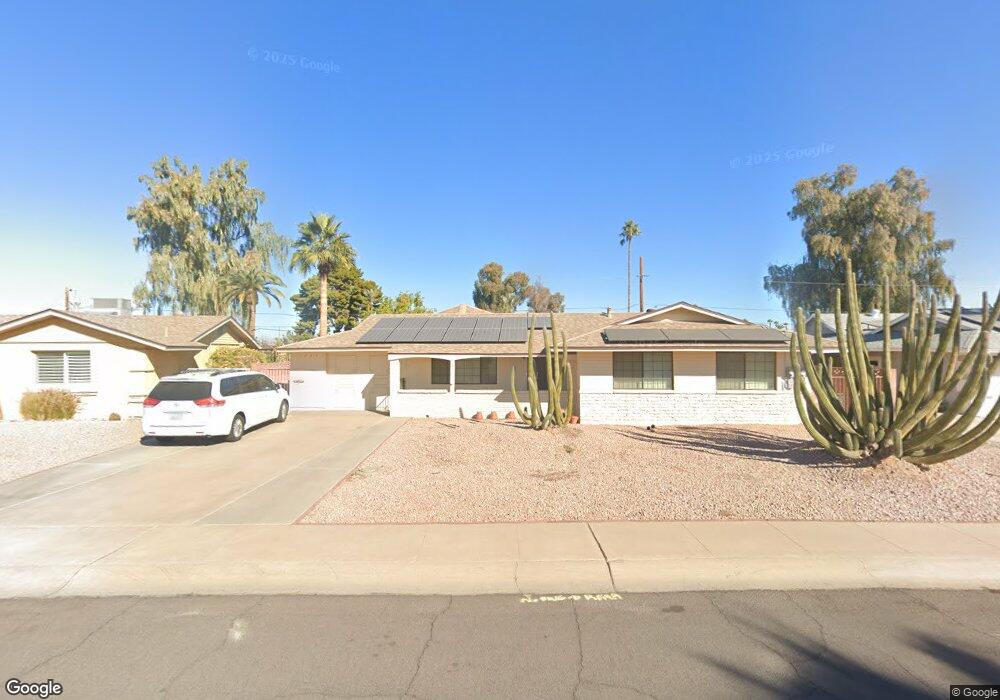
12457 N Cherry Hills Dr E Sun City, AZ 85351
Estimated Value: $285,223 - $377,000
--
Bed
2
Baths
2,145
Sq Ft
$155/Sq Ft
Est. Value
About This Home
This home is located at 12457 N Cherry Hills Dr E, Sun City, AZ 85351 and is currently estimated at $332,556, approximately $155 per square foot. 12457 N Cherry Hills Dr E is a home located in Maricopa County with nearby schools including Desert Mirage Elementary School and Ombudsman - Northwest Charter.
Ownership History
Date
Name
Owned For
Owner Type
Purchase Details
Closed on
Feb 28, 2020
Sold by
Mccusker Charlotte Joanne
Bought by
Mccusker Charlotte Joanne and Ruiz Jennifer Anne
Current Estimated Value
Purchase Details
Closed on
Dec 9, 2014
Sold by
Mccusker Charlotte Joanne
Bought by
Mccusker Charlotte Joanne
Purchase Details
Closed on
Jan 13, 2014
Sold by
Mccusker Charlotte Joanne and The William Edward Mccusker &
Bought by
Mccusker Charlotte Joanne
Purchase Details
Closed on
May 5, 2005
Sold by
Mccusker William Edward and Mccusker Charlotte Joanne
Bought by
Mccusker William Edward and Mccusker Charlotte Joanne
Purchase Details
Closed on
Nov 15, 1994
Sold by
Henning Betty V
Bought by
Mccusker William E and Mccusker Charlotte J
Home Financials for this Owner
Home Financials are based on the most recent Mortgage that was taken out on this home.
Original Mortgage
$64,600
Interest Rate
9.1%
Mortgage Type
New Conventional
Create a Home Valuation Report for This Property
The Home Valuation Report is an in-depth analysis detailing your home's value as well as a comparison with similar homes in the area
Home Values in the Area
Average Home Value in this Area
Purchase History
| Date | Buyer | Sale Price | Title Company |
|---|---|---|---|
| Mccusker Charlotte Joanne | -- | None Available | |
| Mccusker Charlotte Joanne | -- | None Available | |
| Mccusker Charlotte Joanne | -- | None Available | |
| Mccusker William Edward | -- | -- | |
| Mccusker William E | $68,000 | United Title Agency |
Source: Public Records
Mortgage History
| Date | Status | Borrower | Loan Amount |
|---|---|---|---|
| Previous Owner | Mccusker William E | $64,600 |
Source: Public Records
Tax History Compared to Growth
Tax History
| Year | Tax Paid | Tax Assessment Tax Assessment Total Assessment is a certain percentage of the fair market value that is determined by local assessors to be the total taxable value of land and additions on the property. | Land | Improvement |
|---|---|---|---|---|
| 2025 | $1,418 | $16,813 | -- | -- |
| 2024 | $1,284 | $16,012 | -- | -- |
| 2023 | $1,284 | $28,810 | $5,760 | $23,050 |
| 2022 | $1,197 | $21,520 | $4,300 | $17,220 |
| 2021 | $1,234 | $20,510 | $4,100 | $16,410 |
| 2020 | $1,202 | $18,710 | $3,740 | $14,970 |
| 2019 | $1,206 | $18,100 | $3,620 | $14,480 |
| 2018 | $1,164 | $16,850 | $3,370 | $13,480 |
| 2017 | $1,128 | $15,170 | $3,030 | $12,140 |
| 2016 | $1,051 | $14,070 | $2,810 | $11,260 |
| 2015 | $994 | $12,420 | $2,480 | $9,940 |
Source: Public Records
Map
Nearby Homes
- 12454 N Cherry Hills Dr E
- 12244 N Saint Andrew Dr E
- 12250 N Cherry Hills Dr E
- 12216 N 107th Ave
- 10638 W Alabama Ave
- 10620 W Oakmont Dr
- 10582 W Oakmont Dr
- 12248 N 105th Ave
- 10719 W Alabama Ave
- 10547 W Coggins Dr
- 10433 W Oakmont Dr
- 10559 W Coggins Dr
- 12021 N Riviera Ct
- 10541 W Coggins Dr
- 12033 N Hillcrest Dr
- 10523 W Coggins Dr
- 10458 W Oakmont Dr
- 12035 N Cherry Hills Dr E
- 10544 W Coggins Dr
- 10540 W Coggins Dr Unit 1C
- 12463 N Cherry Hills Dr E Unit 1
- 12467 N Cherry Hills Dr E
- 12462 N Cherry Hills Dr E
- 12448 N Cherry Hills Dr E
- 12466 N Cherry Hills Dr E
- 12439 N Cherry Hills Dr E
- 12442 N Cherry Hills Dr E
- 12437 N Saint Andrew Dr E Unit 1
- 12431 N Saint Andrew Dr E
- 12439 N Saint Andrew Dr E
- 12433 N Cherry Hills Dr E
- 12421 N Saint Andrew Dr E
- 12434 N Cherry Hills Dr E
- 12419 N Saint Andrew Dr E
- 12429 N Cherry Hills Dr E
- 12606 N 107th Ave
- 12648 Saint Andrew Dr
- 12428 N Cherry Hills Dr E
- 12438 W Cherry Hills Dr
- 12614 N 107th Ave