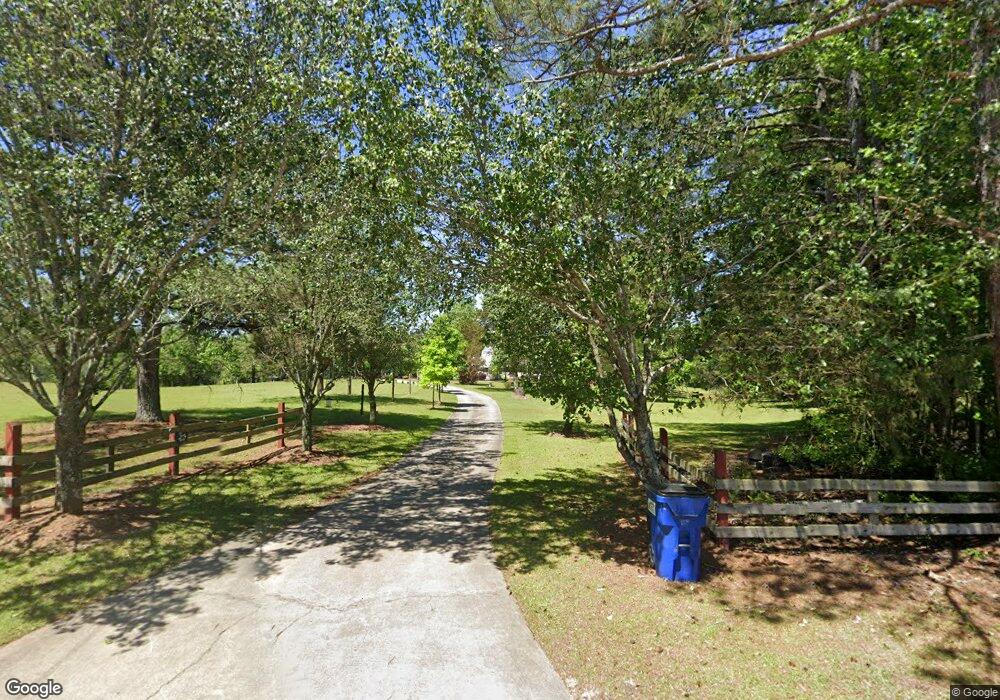
1249 Jones Ferry Rd Elberton, GA 30635
Estimated Value: $428,000 - $524,000
5
Beds
3
Baths
2,378
Sq Ft
$203/Sq Ft
Est. Value
About This Home
This home is located at 1249 Jones Ferry Rd, Elberton, GA 30635 and is currently estimated at $483,821, approximately $203 per square foot. 1249 Jones Ferry Rd is a home located in Elbert County with nearby schools including Elbert County Elementary School, Elbert County Primary School, and Elbert County Middle School.
Ownership History
Date
Name
Owned For
Owner Type
Purchase Details
Closed on
Aug 1, 2007
Sold by
Baldwin Gina Anne
Bought by
Wyllie Scott E
Current Estimated Value
Purchase Details
Closed on
Oct 1, 2004
Sold by
Baldwin Gina Anne & Nan S Fitz 4E
Bought by
Baldwin Gina Anne
Purchase Details
Closed on
Jun 23, 2004
Sold by
Mclaughlin Rose 4E
Bought by
Baldwin Gina Anne & Nan S Fitzgerald
Purchase Details
Closed on
Mar 15, 2002
Sold by
Gunter Gunter H and Gunter Ann W
Bought by
Mclaughlin Rose
Purchase Details
Closed on
Mar 16, 2001
Sold by
Jackson Cleo E and Jackson Vickie B
Bought by
Gunter Gunter H and Gunter Ann W
Purchase Details
Closed on
Mar 2, 1999
Bought by
Gunter
Purchase Details
Closed on
Oct 1, 1997
Purchase Details
Closed on
Sep 1, 1997
Purchase Details
Closed on
Oct 1, 1990
Purchase Details
Closed on
May 1, 1966
Purchase Details
Closed on
Jan 1, 1960
Create a Home Valuation Report for This Property
The Home Valuation Report is an in-depth analysis detailing your home's value as well as a comparison with similar homes in the area
Home Values in the Area
Average Home Value in this Area
Purchase History
| Date | Buyer | Sale Price | Title Company |
|---|---|---|---|
| Wyllie Scott E | $335,000 | -- | |
| Baldwin Gina Anne | -- | -- | |
| Baldwin Gina Anne & Nan S Fitzgerald | $220,000 | -- | |
| Mclaughlin Rose | $176,000 | -- | |
| Gunter Gunter H | $151,500 | -- | |
| Gunter | $135,000 | -- | |
| -- | $120,000 | -- | |
| -- | $106,900 | -- | |
| -- | $68,000 | -- | |
| -- | $7,200 | -- | |
| -- | -- | -- |
Source: Public Records
Tax History Compared to Growth
Tax History
| Year | Tax Paid | Tax Assessment Tax Assessment Total Assessment is a certain percentage of the fair market value that is determined by local assessors to be the total taxable value of land and additions on the property. | Land | Improvement |
|---|---|---|---|---|
| 2024 | $3,483 | $164,608 | $24,320 | $140,288 |
| 2023 | $3,480 | $164,608 | $24,320 | $140,288 |
| 2022 | $2,684 | $123,100 | $14,476 | $108,624 |
| 2021 | $2,685 | $123,100 | $14,476 | $108,624 |
| 2020 | $2,305 | $93,714 | $11,581 | $82,133 |
| 2019 | $2,393 | $93,714 | $11,581 | $82,133 |
| 2018 | $2,463 | $93,714 | $11,581 | $82,133 |
| 2017 | $2,200 | $81,170 | $11,581 | $69,589 |
| 2016 | $2,028 | $80,311 | $11,581 | $68,730 |
| 2015 | -- | $80,310 | $11,581 | $68,730 |
| 2014 | -- | $80,310 | $11,581 | $68,730 |
| 2013 | -- | $80,310 | $11,581 | $68,730 |
Source: Public Records
Map
Nearby Homes
- 6 Cedar Creek
- 9 Cedar Creek Rd
- 0 Athens Hwy Unit 10627639
- 1408 Grady Cleveland Rd
- 2087 Athens Hwy
- 10 Cedar Creek Rd
- 5 Cedar Creek Rd
- 14 Cedar Creek Rd
- 11 Cedar Creek Rd
- 1478 Mineral Springs Rd
- 1617 Sweet City Rd
- 0 Mineral Springs Rd Unit 10455464
- 0 Mineral Springs Rd Unit 10455495
- 0 Mineral Springs Rd Unit 10455479
- 0 Crystal Dr Unit 10400125
- 0 Coggins Dr
- 00 Lexington Hwy
- 0 Rhodes Dr Unit 10455518
- 00 Athens Hwy
- 518 Fambrough Dr
- 1246 Jones Ferry Rd
- 1288 Jones Ferry Rd
- 1294 Jones Ferry Rd
- 1311 Jones Ferry Rd
- 1197 Jones Ferry Rd
- 1204 Jones Ferry Rd
- 1187 Jones Ferry Rd
- 1329 Jones Ferry Rd
- 1167 Jones Ferry Rd
- 1356 Jones Ferry Rd
- 1776 Limo Rd
- 1165 Jones Ferry Rd
- 1162 Jones Ferry Rd
- 1365 Jones Ferry Rd
- 1143 Jones Ferry Rd
- 1615 George Thomason Dr
- 1604 Boyd Miller Dr
- 1124 Jones Ferry Rd
- 1616 Boyd Miller Dr
- 1623 Boyd Miller Dr