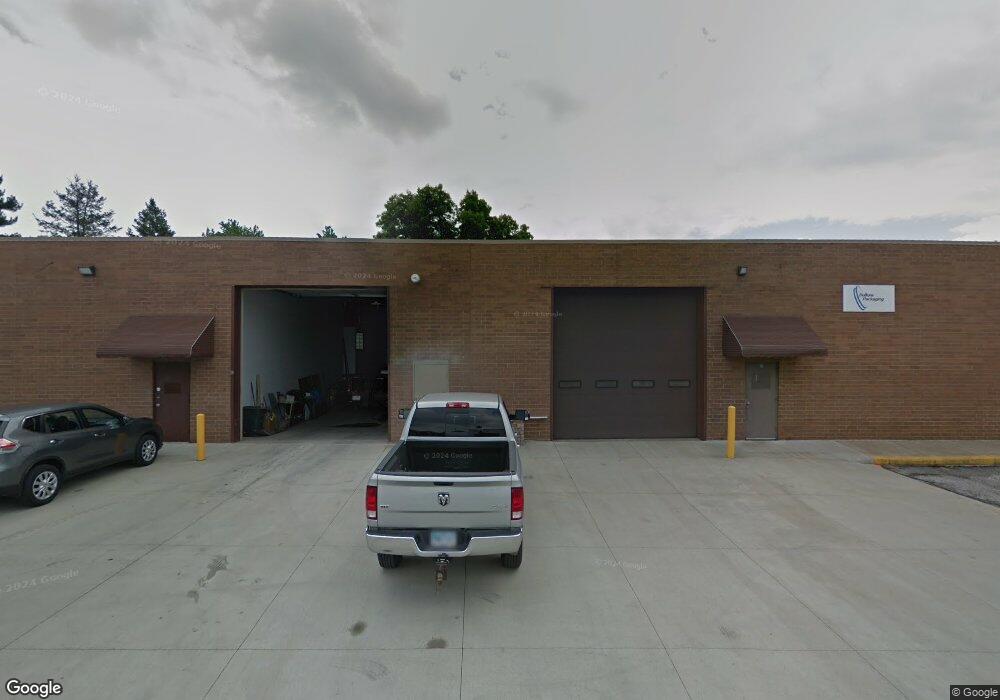
12492 York Rd North Royalton, OH 44133
Estimated Value: $1,751,520
--
Bed
--
Bath
33,716
Sq Ft
$52/Sq Ft
Est. Value
About This Home
This home is located at 12492 York Rd, North Royalton, OH 44133 and is currently estimated at $1,751,520, approximately $51 per square foot. 12492 York Rd is a home located in Cuyahoga County with nearby schools including North Royalton Middle School, North Royalton High School, and Saint Albert the Great Roman Catholic School.
Ownership History
Date
Name
Owned For
Owner Type
Purchase Details
Closed on
May 10, 2017
Sold by
Matteo Carmen A
Bought by
Matteo Business Park Llc
Current Estimated Value
Purchase Details
Closed on
Jul 19, 2013
Sold by
Zivkovic Ljubisa and Zivkovic Vitomirka
Bought by
Matteo Carmen A
Home Financials for this Owner
Home Financials are based on the most recent Mortgage that was taken out on this home.
Original Mortgage
$375,000
Interest Rate
3.91%
Mortgage Type
Future Advance Clause Open End Mortgage
Purchase Details
Closed on
Jan 8, 2004
Sold by
Zivkovic Ljubisa and Zivkovic Vitromirka
Bought by
Pavlin Theodore C
Home Financials for this Owner
Home Financials are based on the most recent Mortgage that was taken out on this home.
Original Mortgage
$105,000
Interest Rate
3%
Mortgage Type
Seller Take Back
Purchase Details
Closed on
Jan 1, 1975
Bought by
Zivkovic Ljubisa and Zivkovic Zivkovic
Create a Home Valuation Report for This Property
The Home Valuation Report is an in-depth analysis detailing your home's value as well as a comparison with similar homes in the area
Home Values in the Area
Average Home Value in this Area
Purchase History
| Date | Buyer | Sale Price | Title Company |
|---|---|---|---|
| Matteo Business Park Llc | -- | Gateway Title Agency | |
| Matteo Carmen A | $740,000 | Gateway Title Agency | |
| Pavlin Theodore C | $125,000 | Progressive Land Title | |
| Zivkovic Ljubisa | -- | -- |
Source: Public Records
Mortgage History
| Date | Status | Borrower | Loan Amount |
|---|---|---|---|
| Previous Owner | Matteo Carmen A | $375,000 | |
| Previous Owner | Pavlin Theodore C | $105,000 |
Source: Public Records
Tax History Compared to Growth
Tax History
| Year | Tax Paid | Tax Assessment Tax Assessment Total Assessment is a certain percentage of the fair market value that is determined by local assessors to be the total taxable value of land and additions on the property. | Land | Improvement |
|---|---|---|---|---|
| 2024 | $42,893 | $606,620 | $76,580 | $530,040 |
| 2023 | $38,400 | $527,660 | $77,770 | $449,890 |
| 2022 | $40,324 | $527,660 | $77,770 | $449,890 |
| 2021 | $41,135 | $527,660 | $77,770 | $449,890 |
| 2020 | $38,377 | $479,680 | $70,700 | $408,980 |
| 2019 | $37,390 | $1,370,500 | $202,000 | $1,168,500 |
| 2018 | $37,722 | $479,680 | $70,700 | $408,980 |
| 2017 | $21,961 | $256,410 | $65,100 | $191,310 |
| 2016 | $21,018 | $256,410 | $65,100 | $191,310 |
| 2015 | $21,154 | $256,410 | $65,100 | $191,310 |
| 2014 | $21,154 | $259,010 | $65,770 | $193,240 |
Source: Public Records
Map
Nearby Homes
- 9035 Wallings Rd
- 10342 Independence Dr Unit 21B
- 9611 Sunrise Blvd Unit K2
- 12906 Cartwright Pkwy
- 13000 Cartwright Pkwy
- 11550 York Rd
- 10364 Independence Dr Unit 19c
- 9761 Sunrise Blvd
- 9530 Cove Dr Unit C-25
- 9510 Cove Dr Unit C12
- 10560 Independence Dr Unit 25A
- 9660 Cove Dr Unit F13
- 9710 Cove Dr Unit 23G
- 9821 Sunrise Blvd Unit o1
- 12701 Gordon St
- 9800 Cove Dr Unit H2
- 7554 Margaret Dr
- 7595 Margaret Dr
- 7545 Margaret Dr
- 7585 Margaret Dr
- 12492 York Rd Unit 1249
- 12646 York Rd
- 12412 York Rd
- 12496 York Rd
- 12316 York Rd
- 12421 York Rd
- 12220 York Rd
- 12479 York Rd
- 12136 York Rd Unit A
- 12136 York Rd Unit E
- 12136 York Rd Unit B
- 12136 York Rd Unit C
- 0 Harley Hills Dr
- 9185 Traditions Way
- 12126 York Rd Unit A
- 12126 York Rd Unit B
- 12126 York Rd Unit C
- 13000 York Rd
- 12147 York Rd
- 12125 York Rd