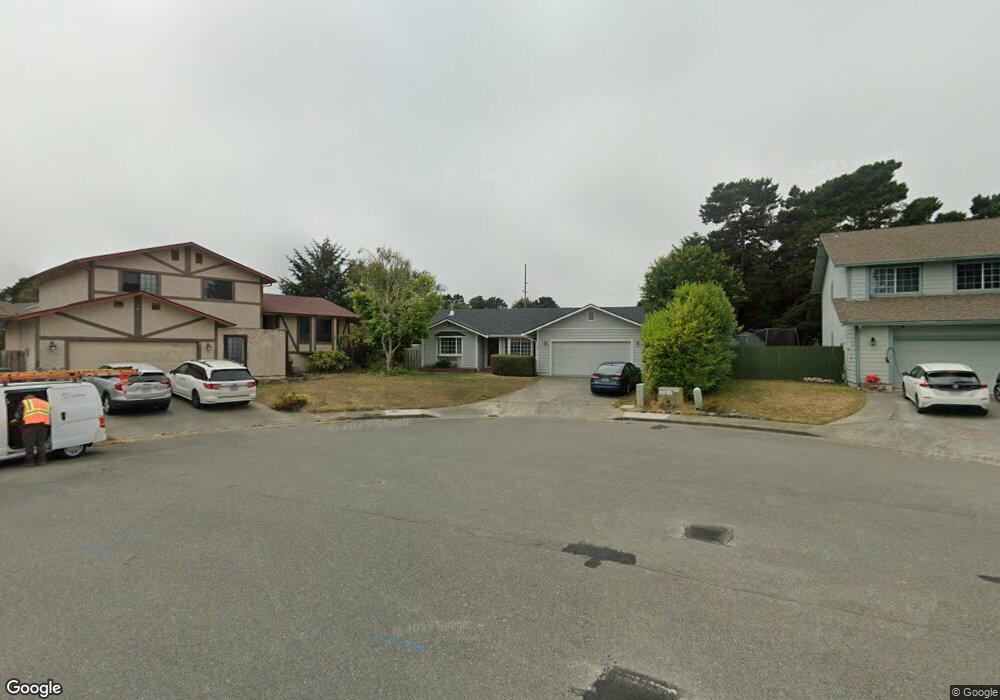
125 Cherrywood Ct Crescent City, CA 95531
Estimated Value: $390,000 - $430,000
3
Beds
2
Baths
1,674
Sq Ft
$244/Sq Ft
Est. Value
About This Home
This home is located at 125 Cherrywood Ct, Crescent City, CA 95531 and is currently estimated at $407,795, approximately $243 per square foot. 125 Cherrywood Ct is a home located in Del Norte County with nearby schools including Mary Peacock Elementary School, Crescent Elk Middle School, and Del Norte High School.
Ownership History
Date
Name
Owned For
Owner Type
Purchase Details
Closed on
Sep 11, 2020
Sold by
Hogan Diane and Hogan Rex
Bought by
Hogan Diane
Current Estimated Value
Home Financials for this Owner
Home Financials are based on the most recent Mortgage that was taken out on this home.
Original Mortgage
$204,200
Outstanding Balance
$181,214
Interest Rate
2.9%
Mortgage Type
New Conventional
Estimated Equity
$226,581
Purchase Details
Closed on
Oct 16, 2018
Sold by
Hogan Rex
Bought by
Hogan Diane
Purchase Details
Closed on
Feb 20, 2003
Sold by
Baird Joseph C and Baird Barbara L
Bought by
Hogan Rex and Hogan Diane
Home Financials for this Owner
Home Financials are based on the most recent Mortgage that was taken out on this home.
Original Mortgage
$116,850
Interest Rate
5.33%
Mortgage Type
Purchase Money Mortgage
Create a Home Valuation Report for This Property
The Home Valuation Report is an in-depth analysis detailing your home's value as well as a comparison with similar homes in the area
Home Values in the Area
Average Home Value in this Area
Purchase History
| Date | Buyer | Sale Price | Title Company |
|---|---|---|---|
| Hogan Diane | -- | Consumers Title | |
| Hogan Diane | -- | Crescent Land Title Co | |
| Hogan Rex | $123,000 | Crescent Land Title |
Source: Public Records
Mortgage History
| Date | Status | Borrower | Loan Amount |
|---|---|---|---|
| Open | Hogan Diane | $204,200 | |
| Closed | Hogan Rex | $116,850 |
Source: Public Records
Tax History Compared to Growth
Tax History
| Year | Tax Paid | Tax Assessment Tax Assessment Total Assessment is a certain percentage of the fair market value that is determined by local assessors to be the total taxable value of land and additions on the property. | Land | Improvement |
|---|---|---|---|---|
| 2025 | $2,163 | $188,258 | $43,438 | $144,820 |
| 2024 | $2,163 | $184,568 | $42,587 | $141,981 |
| 2023 | $2,058 | $180,950 | $41,752 | $139,198 |
| 2022 | $2,018 | $177,403 | $40,934 | $136,469 |
| 2021 | $1,933 | $173,926 | $40,132 | $133,794 |
| 2020 | $1,864 | $172,144 | $39,721 | $132,423 |
| 2019 | $1,862 | $171,410 | $38,943 | $132,467 |
| 2018 | $1,828 | $168,432 | $38,180 | $130,252 |
| 2017 | $1,907 | $162,219 | $37,432 | $124,787 |
| 2016 | $1,878 | $162,835 | $36,699 | $126,136 |
| 2015 | $1,852 | $160,832 | $36,148 | $124,684 |
| 2014 | $1,832 | $153,584 | $35,440 | $118,144 |
Source: Public Records
Map
Nearby Homes
- 1745 Potomac Ct
- 1760 Amador St
- 00 Adams Ave
- 115 Georgetown Place
- 275 Chevy Chase Way
- 125 W Washington Blvd
- 188 E Madison Ave
- 000 Isabella
- 0 E Adams Ave
- 1718 Northcrest Dr
- 1725 Northcrest Dr
- 120 W Coolidge Ave
- 1811 Northcrest Dr
- 1950 Northcrest Dr
- 1661 Northcrest Dr Unit Space 96
- 145 Mason Ct
- 1775 Northcrest Dr
- 0000 E Washington Blvd
- 95 Dell Ln
- 2234 Harmony Ln
- 135 Cherrywood Ct
- 115 Cherrywood Ct
- 1665 Del Mar Rd
- 1655 Del Mar Rd
- 1630 Franklin Ct
- 1635 Franklin Ct
- 130 Cherrywood Ct
- 105 Cherrywood Ct
- 1695 Del Mar Rd
- 120 Cherrywood Ct
- 1641 Del Mar Rd
- 110 Cherrywood Ct
- 1620 Franklin Ct
- 100 Cherrywood Ct
- 1684 Del Mar Rd
- 1664 Del Mar Rd
- 1625 Del Mar Rd
- 1692 Del Mar Rd
- 1700 Potomac Ct
- 1615 Franklin Ct