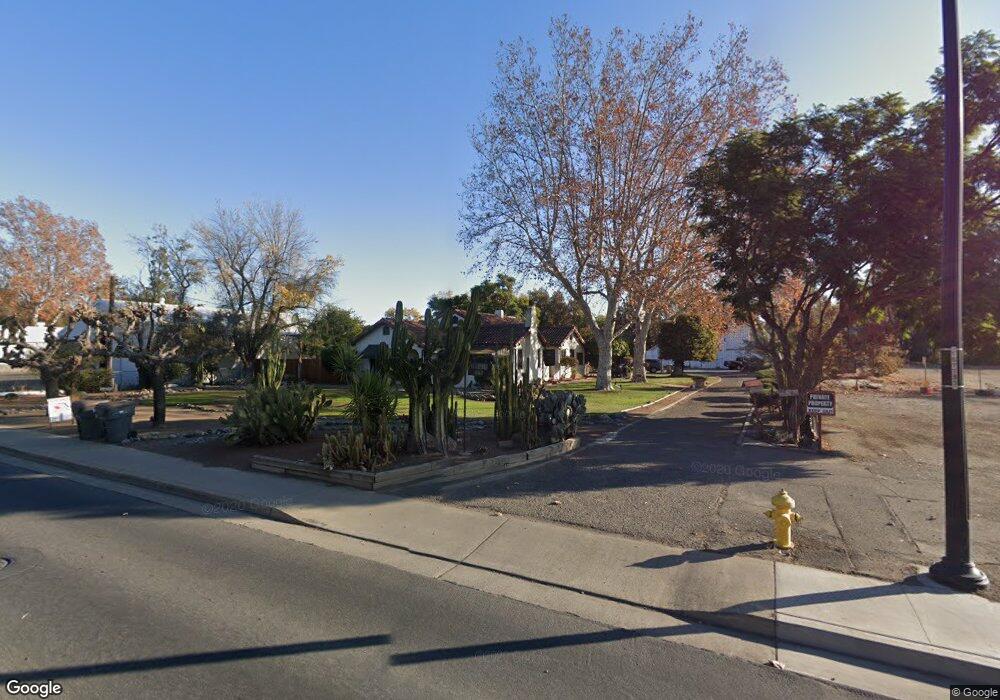
125 East St Unit A Woodland, CA 95776
Estimated Value: $898,548 - $906,000
5
Beds
3
Baths
2,981
Sq Ft
$303/Sq Ft
Est. Value
About This Home
This home is located at 125 East St Unit A, Woodland, CA 95776 and is currently estimated at $902,274, approximately $302 per square foot. 125 East St Unit A is a home located in Yolo County with nearby schools including Gibson Elementary School, Douglass Middle School, and Pioneer High School.
Ownership History
Date
Name
Owned For
Owner Type
Purchase Details
Closed on
Jun 23, 2021
Sold by
Mendoza Victoria
Bought by
Mendoza Mario
Current Estimated Value
Home Financials for this Owner
Home Financials are based on the most recent Mortgage that was taken out on this home.
Original Mortgage
$742,000
Outstanding Balance
$671,789
Interest Rate
2.9%
Mortgage Type
New Conventional
Estimated Equity
$230,485
Purchase Details
Closed on
Jun 17, 2021
Sold by
Basrai Sarb
Bought by
Mendoza Mario and Avil Yeni
Home Financials for this Owner
Home Financials are based on the most recent Mortgage that was taken out on this home.
Original Mortgage
$742,000
Outstanding Balance
$671,789
Interest Rate
2.9%
Mortgage Type
New Conventional
Estimated Equity
$230,485
Purchase Details
Closed on
Apr 15, 2021
Sold by
Tafoya Ruben George and Ruben George Tofoya Revocable
Bought by
Basrai Serb
Purchase Details
Closed on
May 18, 2016
Sold by
Tafoya Ruben George
Bought by
Tafoya Ruben George
Create a Home Valuation Report for This Property
The Home Valuation Report is an in-depth analysis detailing your home's value as well as a comparison with similar homes in the area
Home Values in the Area
Average Home Value in this Area
Purchase History
| Date | Buyer | Sale Price | Title Company |
|---|---|---|---|
| Mendoza Mario | -- | New Title Company Name | |
| Mendoza Mario | $825,000 | Calatlantic Title | |
| Basrai Serb | $799,000 | Lennar Title Inc | |
| Tafoya Ruben George | -- | None Available |
Source: Public Records
Mortgage History
| Date | Status | Borrower | Loan Amount |
|---|---|---|---|
| Open | Mendoza Mario | $742,000 |
Source: Public Records
Tax History Compared to Growth
Tax History
| Year | Tax Paid | Tax Assessment Tax Assessment Total Assessment is a certain percentage of the fair market value that is determined by local assessors to be the total taxable value of land and additions on the property. | Land | Improvement |
|---|---|---|---|---|
| 2025 | $9,206 | $893,004 | $248,958 | $644,046 |
| 2023 | $9,206 | $858,330 | $239,292 | $619,038 |
| 2022 | $8,846 | $841,500 | $234,600 | $606,900 |
| 2021 | $3,241 | $307,159 | $113,762 | $193,397 |
| 2020 | $3,195 | $304,010 | $112,596 | $191,414 |
| 2019 | $3,135 | $298,050 | $110,389 | $187,661 |
| 2018 | $3,103 | $292,207 | $108,225 | $183,982 |
| 2017 | $3,036 | $286,478 | $106,103 | $180,375 |
| 2016 | $2,984 | $280,862 | $104,023 | $176,839 |
| 2015 | $2,939 | $276,644 | $102,461 | $174,183 |
| 2014 | $2,884 | $271,225 | $100,454 | $170,771 |
Source: Public Records
Map
Nearby Homes
- 125 East St
- 145 East St
- 1037 Elliot St
- 110 N East St
- 102 N East St
- 102 Railroad St
- 1033 Elliot St Unit 35
- 1032 Elliot St
- 96 N East St
- 1027 Elliot St
- 1028 Elliot St
- 1024 Elliot St
- 1012 Elliot St
- 1011 Elliot St Unit 15
- 1024 Clover St
- 1020 Elliot St
- 1023 North St
- 1007 Elliot St
- 1023 Clover St
- 1046 North St