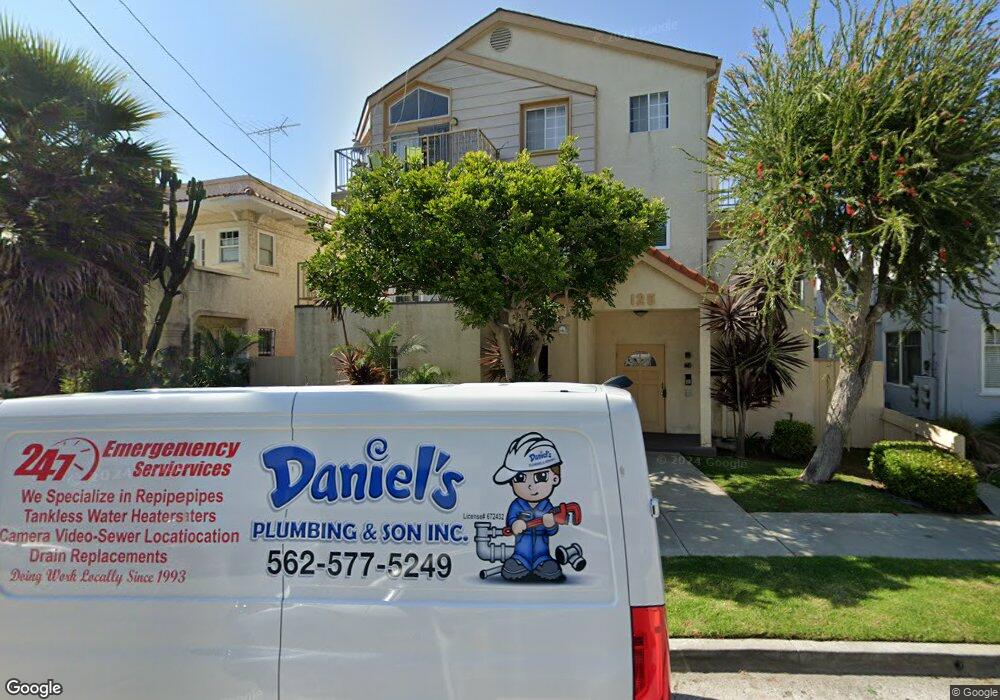
125 Grand Ave Long Beach, CA 90803
Belmont Heights NeighborhoodEstimated Value: $1,893,000 - $2,130,000
2
Beds
2
Baths
--
Sq Ft
4,008
Sq Ft Lot
About This Home
This home is located at 125 Grand Ave, Long Beach, CA 90803 and is currently estimated at $1,993,333. 125 Grand Ave is a home located in Los Angeles County with nearby schools including Mann Elementary School, Woodrow Wilson High School, and Maple Village Waldorf School.
Ownership History
Date
Name
Owned For
Owner Type
Purchase Details
Closed on
Feb 27, 2002
Sold by
Burnes James T and Burnes Fatemeh
Bought by
Jarbeek Properties Llc
Current Estimated Value
Home Financials for this Owner
Home Financials are based on the most recent Mortgage that was taken out on this home.
Original Mortgage
$300,000
Interest Rate
6.84%
Mortgage Type
Purchase Money Mortgage
Purchase Details
Closed on
Feb 26, 2002
Sold by
Mooradian George T and Mooradian Hasmik L
Bought by
Jarbeek Properties Llc
Home Financials for this Owner
Home Financials are based on the most recent Mortgage that was taken out on this home.
Original Mortgage
$300,000
Interest Rate
6.84%
Mortgage Type
Purchase Money Mortgage
Purchase Details
Closed on
Oct 26, 1993
Sold by
Jarbeek Properties
Bought by
Mooradian George T
Home Financials for this Owner
Home Financials are based on the most recent Mortgage that was taken out on this home.
Original Mortgage
$458,000
Interest Rate
6.95%
Create a Home Valuation Report for This Property
The Home Valuation Report is an in-depth analysis detailing your home's value as well as a comparison with similar homes in the area
Home Values in the Area
Average Home Value in this Area
Purchase History
| Date | Buyer | Sale Price | Title Company |
|---|---|---|---|
| Jarbeek Properties Llc | -- | Stewart Title | |
| Burnes James T | -- | -- | |
| Jarbeek Properties Llc | -- | Stewart Title | |
| Mooradian George T | -- | Stewart Title | |
| Mooradian George T | -- | First American Title Company |
Source: Public Records
Mortgage History
| Date | Status | Borrower | Loan Amount |
|---|---|---|---|
| Closed | Burnes James T | $300,000 | |
| Closed | Mooradian George T | $300,000 | |
| Previous Owner | Mooradian George T | $458,000 |
Source: Public Records
Tax History Compared to Growth
Tax History
| Year | Tax Paid | Tax Assessment Tax Assessment Total Assessment is a certain percentage of the fair market value that is determined by local assessors to be the total taxable value of land and additions on the property. | Land | Improvement |
|---|---|---|---|---|
| 2025 | $15,016 | $1,159,710 | $375,304 | $784,406 |
| 2024 | $15,016 | $1,136,972 | $367,946 | $769,026 |
| 2023 | $14,763 | $1,114,680 | $360,732 | $753,948 |
| 2022 | $13,862 | $1,092,824 | $353,659 | $739,165 |
| 2021 | $13,574 | $1,071,397 | $346,725 | $724,672 |
| 2019 | $13,380 | $1,039,621 | $336,442 | $703,179 |
| 2018 | $13,022 | $1,019,238 | $329,846 | $689,392 |
| 2016 | $11,965 | $979,662 | $317,039 | $662,623 |
| 2015 | $11,486 | $964,947 | $312,277 | $652,670 |
| 2014 | $11,411 | $946,046 | $306,160 | $639,886 |
Source: Public Records
Map
Nearby Homes
- 3737 E 2nd St Unit 301
- 210 Grand Ave Unit 201
- 3641 E 1st St
- 207 Mira Mar Ave
- 206 Euclid Ave
- 3707 E Livingston Dr Unit 403
- 202 Mira Mar Ave
- 215 Mira Mar Ave
- 3811 E Livingston Dr Unit 1
- 3901 E Livingston Dr Unit 402
- 3601 E Ocean Blvd Unit 2C
- 116 Termino Ave
- 7 37th Place
- 16 36th Place Unit F
- 3939 E Allin St Unit 109
- 242 Euclid Ave
- 249 Loma Ave
- 4257 E Ocean Blvd
- 3234 E Broadway
- 60 Bennett Ave
- 3704 E 2nd St
- 119 Grand Ave
- 117 Grand Ave
- 119 Euclid Ave
- 120 Grand Ave Unit 310
- 120 Grand Ave
- 125 Euclid Ave
- 115 Euclid Ave
- 104 Euclid Ave
- 3656 2nd St
- 3719 E 1st Street 103 Grand
- 112 Grand Ave
- 3719 E 1st St Unit C
- 3701 E 1st St
- 3805 E 2nd St Unit A
- 3805 E 2nd St Unit B
- 3805 E 2nd St Unit C
- 3805 E 2nd St
- 3737 E 2nd St Unit 302
- 3737 E 2nd St Unit 206