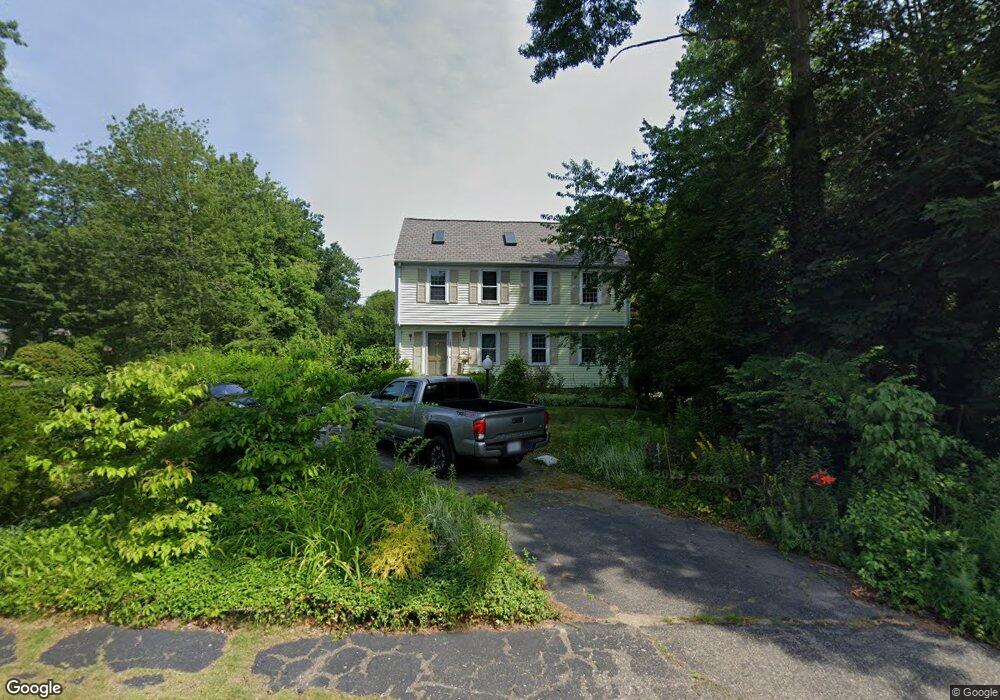
125 Pleasant Dr Bridgewater, MA 02324
Estimated Value: $589,332 - $669,000
3
Beds
2
Baths
1,568
Sq Ft
$405/Sq Ft
Est. Value
About This Home
This home is located at 125 Pleasant Dr, Bridgewater, MA 02324 and is currently estimated at $635,583, approximately $405 per square foot. 125 Pleasant Dr is a home located in Plymouth County with nearby schools including Mitchell Elementary School, Williams Intermediate School, and Bridgewater Middle School.
Ownership History
Date
Name
Owned For
Owner Type
Purchase Details
Closed on
Jan 11, 2023
Sold by
Hirschy David C
Bought by
H & V Family 2022 Ret
Current Estimated Value
Purchase Details
Closed on
Sep 23, 1996
Sold by
Pleasant T
Bought by
Hirschy David C
Home Financials for this Owner
Home Financials are based on the most recent Mortgage that was taken out on this home.
Original Mortgage
$126,350
Interest Rate
7.89%
Mortgage Type
Purchase Money Mortgage
Purchase Details
Closed on
Jun 24, 1991
Sold by
Vals Family Rt
Bought by
Pleasant T
Home Financials for this Owner
Home Financials are based on the most recent Mortgage that was taken out on this home.
Original Mortgage
$142,000
Interest Rate
9.37%
Mortgage Type
Purchase Money Mortgage
Create a Home Valuation Report for This Property
The Home Valuation Report is an in-depth analysis detailing your home's value as well as a comparison with similar homes in the area
Home Values in the Area
Average Home Value in this Area
Purchase History
| Date | Buyer | Sale Price | Title Company |
|---|---|---|---|
| H & V Family 2022 Ret | -- | None Available | |
| Hirschy David C | $133,000 | -- | |
| Pleasant T | $157,601 | -- |
Source: Public Records
Mortgage History
| Date | Status | Borrower | Loan Amount |
|---|---|---|---|
| Previous Owner | Pleasant T | $75,000 | |
| Previous Owner | Pleasant T | $121,000 | |
| Previous Owner | Pleasant T | $126,350 | |
| Previous Owner | Pleasant T | $142,000 |
Source: Public Records
Tax History Compared to Growth
Tax History
| Year | Tax Paid | Tax Assessment Tax Assessment Total Assessment is a certain percentage of the fair market value that is determined by local assessors to be the total taxable value of land and additions on the property. | Land | Improvement |
|---|---|---|---|---|
| 2025 | $6,133 | $518,400 | $227,500 | $290,900 |
| 2024 | $5,964 | $491,300 | $216,600 | $274,700 |
| 2023 | $5,947 | $463,200 | $202,400 | $260,800 |
| 2022 | $5,825 | $406,800 | $177,600 | $229,200 |
| 2021 | $5,265 | $363,600 | $158,600 | $205,000 |
| 2020 | $5,391 | $366,000 | $152,400 | $213,600 |
| 2019 | $5,282 | $356,200 | $152,400 | $203,800 |
| 2018 | $5,086 | $334,800 | $148,100 | $186,700 |
| 2017 | $4,922 | $315,300 | $148,100 | $167,200 |
| 2016 | $4,719 | $303,700 | $145,200 | $158,500 |
| 2015 | $4,753 | $292,700 | $140,900 | $151,800 |
| 2014 | $4,651 | $286,200 | $136,800 | $149,400 |
Source: Public Records
Map
Nearby Homes
- 8 North St
- 165 Grange Park
- 50 Stephanie Ln
- 54 Grange Park
- 74 Vernon St
- 35 Stockbridge Rd
- 88 Boxwood Ln
- 331 North St
- 220 Bedford St Unit D-5
- Lot 2 Fontana Way
- 74 Mount Prospect St
- 130 Maple Ave
- 10 College Rd
- 35 Leonard St Unit 35
- 29 Leonard St Unit 29
- 489 Flagg St
- 357 Vernon St
- 180 Main St Unit 2208
- 180 Main St Unit A15
- 180 Main St Unit A5