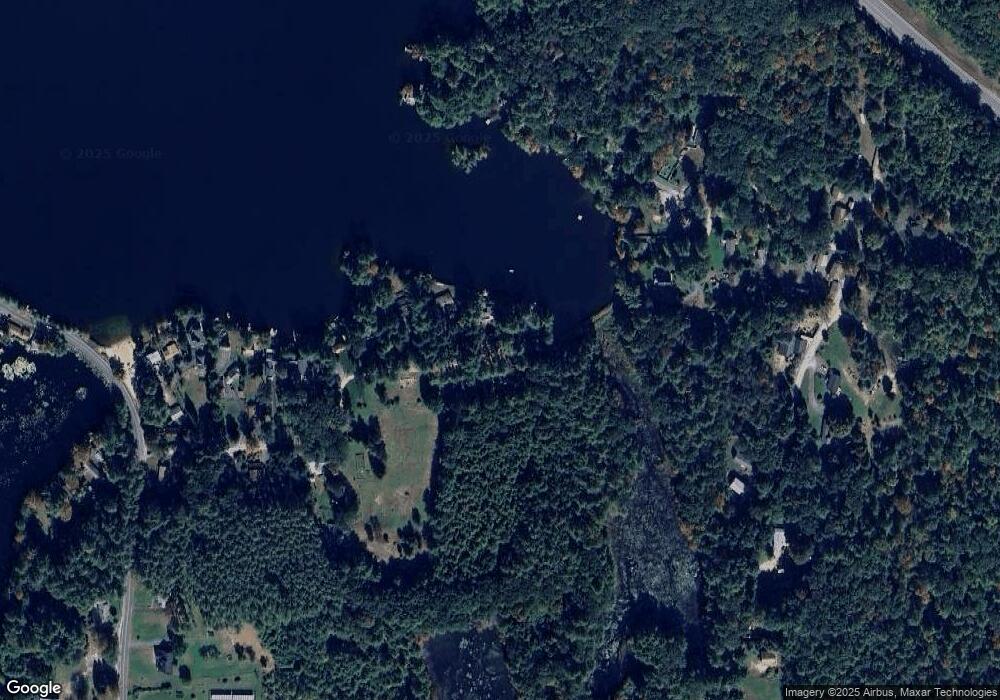
125 S Shore Dr Orange, MA 01364
Estimated Value: $323,337 - $423,000
3
Beds
1
Bath
1,100
Sq Ft
$347/Sq Ft
Est. Value
About This Home
This home is located at 125 S Shore Dr, Orange, MA 01364 and is currently estimated at $381,834, approximately $347 per square foot. 125 S Shore Dr is a home located in Franklin County with nearby schools including Fisher Hill and Ralph C Mahar Regional School.
Ownership History
Date
Name
Owned For
Owner Type
Purchase Details
Closed on
Jan 11, 2016
Sold by
Marsello Nancy L
Bought by
Leguern Etienne J
Current Estimated Value
Purchase Details
Closed on
Apr 8, 2014
Sold by
Marsello Nancy L
Bought by
Marsello Nancy L and Leguern Etienne J
Purchase Details
Closed on
Nov 29, 2011
Sold by
Leguern Etienne J
Bought by
Marsello Nancy L
Purchase Details
Closed on
Feb 9, 2007
Sold by
Marsello Nancy L
Bought by
Leguern Etienne J
Purchase Details
Closed on
Aug 3, 2000
Sold by
Starkey Hazel A Est
Bought by
Marbello Nancy L
Create a Home Valuation Report for This Property
The Home Valuation Report is an in-depth analysis detailing your home's value as well as a comparison with similar homes in the area
Home Values in the Area
Average Home Value in this Area
Purchase History
| Date | Buyer | Sale Price | Title Company |
|---|---|---|---|
| Leguern Etienne J | -- | -- | |
| Marsello Nancy L | -- | -- | |
| Marsello Nancy L | -- | -- | |
| Leguern Etienne J | -- | -- | |
| Marbello Nancy L | $160,000 | -- |
Source: Public Records
Mortgage History
| Date | Status | Borrower | Loan Amount |
|---|---|---|---|
| Previous Owner | Marbello Nancy L | $86,000 |
Source: Public Records
Tax History Compared to Growth
Tax History
| Year | Tax Paid | Tax Assessment Tax Assessment Total Assessment is a certain percentage of the fair market value that is determined by local assessors to be the total taxable value of land and additions on the property. | Land | Improvement |
|---|---|---|---|---|
| 2025 | $50 | $303,000 | $115,900 | $187,100 |
| 2024 | $4,799 | $275,200 | $115,900 | $159,300 |
| 2023 | $4,635 | $258,100 | $108,700 | $149,400 |
| 2022 | $4,610 | $241,100 | $108,700 | $132,400 |
| 2021 | $4,413 | $220,100 | $131,800 | $88,300 |
| 2020 | $4,375 | $215,200 | $129,800 | $85,400 |
| 2019 | $6,641 | $294,900 | $122,700 | $172,200 |
| 2018 | $6,275 | $286,000 | $118,400 | $167,600 |
| 2017 | $5,615 | $264,500 | $96,900 | $167,600 |
| 2016 | $3,947 | $181,900 | $109,600 | $72,300 |
| 2015 | $3,730 | $179,600 | $120,500 | $59,100 |
| 2014 | $3,545 | $179,600 | $120,500 | $59,100 |
Source: Public Records
Map
Nearby Homes