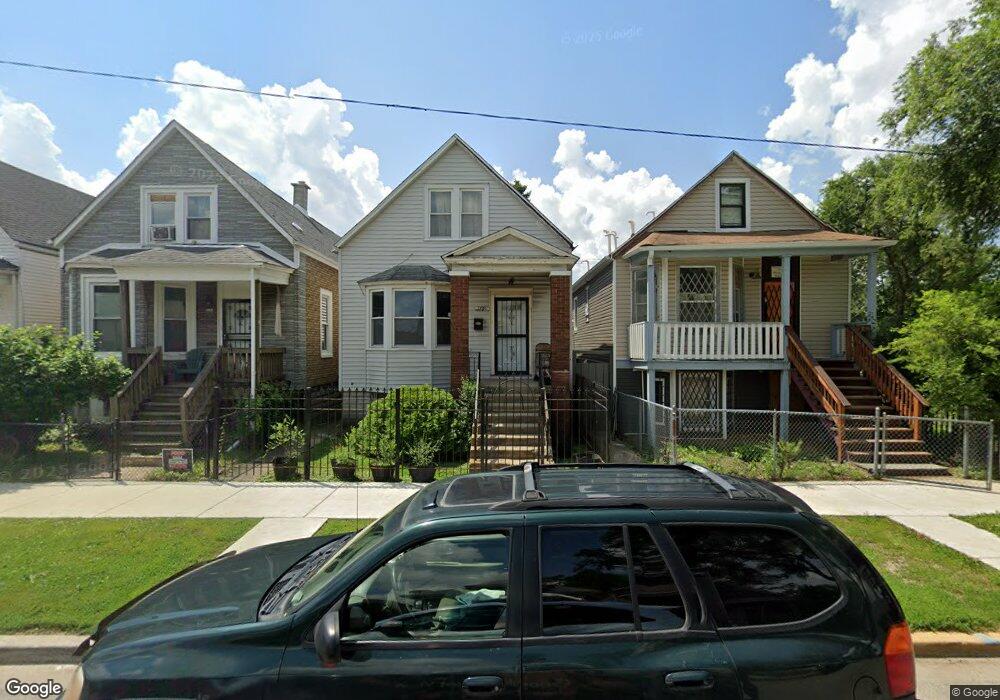
1255 W 73rd Place Chicago, IL 60636
Englewood NeighborhoodEstimated Value: $78,000 - $180,000
4
Beds
2
Baths
714
Sq Ft
$164/Sq Ft
Est. Value
About This Home
This home is located at 1255 W 73rd Place, Chicago, IL 60636 and is currently estimated at $117,265, approximately $164 per square foot. 1255 W 73rd Place is a home located in Cook County with nearby schools including Stagg Elementary School, Bogan Computer Technical High School, and St Sabina Academy.
Ownership History
Date
Name
Owned For
Owner Type
Purchase Details
Closed on
Feb 13, 2025
Sold by
Furdge-Sawyer Tracey
Bought by
Chicago Title Land Trust and Trust Number 9002348113
Current Estimated Value
Purchase Details
Closed on
Oct 29, 2007
Sold by
Crawford Lee Ann and Crawford James
Bought by
Furdge Sawyer Tracey
Home Financials for this Owner
Home Financials are based on the most recent Mortgage that was taken out on this home.
Original Mortgage
$73,000
Interest Rate
6.45%
Mortgage Type
Unknown
Purchase Details
Closed on
Oct 16, 1996
Sold by
Standard Bank & Trust Company
Bought by
Crawford James and Crawford Lee Ann
Home Financials for this Owner
Home Financials are based on the most recent Mortgage that was taken out on this home.
Original Mortgage
$56,851
Interest Rate
7.85%
Mortgage Type
FHA
Purchase Details
Closed on
Apr 16, 1996
Sold by
Johnson Larry and Johnson Carol
Bought by
Standard Bank & Trust Company
Create a Home Valuation Report for This Property
The Home Valuation Report is an in-depth analysis detailing your home's value as well as a comparison with similar homes in the area
Home Values in the Area
Average Home Value in this Area
Purchase History
| Date | Buyer | Sale Price | Title Company |
|---|---|---|---|
| Chicago Title Land Trust | -- | Chicago Title | |
| Furdge Sawyer Tracey | $73,000 | Chicago Title Insurance Co | |
| Crawford James | -- | -- | |
| Standard Bank & Trust Company | $28,000 | -- |
Source: Public Records
Mortgage History
| Date | Status | Borrower | Loan Amount |
|---|---|---|---|
| Previous Owner | Furdge Sawyer Tracey | $73,000 | |
| Previous Owner | Crawford James | $56,851 |
Source: Public Records
Tax History Compared to Growth
Tax History
| Year | Tax Paid | Tax Assessment Tax Assessment Total Assessment is a certain percentage of the fair market value that is determined by local assessors to be the total taxable value of land and additions on the property. | Land | Improvement |
|---|---|---|---|---|
| 2024 | $10 | $3,401 | $938 | $2,463 |
| 2023 | -- | $3,363 | $2,031 | $1,332 |
| 2022 | $0 | $3,363 | $2,031 | $1,332 |
| 2021 | $7 | $3,363 | $2,031 | $1,332 |
| 2020 | $429 | $5,029 | $2,343 | $2,686 |
| 2019 | $434 | $5,588 | $2,343 | $3,245 |
| 2018 | $425 | $5,588 | $2,343 | $3,245 |
| 2017 | $660 | $6,440 | $2,031 | $4,409 |
| 2016 | $790 | $6,440 | $2,031 | $4,409 |
| 2015 | $699 | $6,440 | $2,031 | $4,409 |
| 2014 | $628 | $5,953 | $1,875 | $4,078 |
| 2013 | $604 | $5,953 | $1,875 | $4,078 |
Source: Public Records
Map
Nearby Homes
- 1244 W 74th Place
- 7300 S Racine Ave
- 1241 W 72nd Place
- 7238 S May St
- 7342 S Aberdeen St
- 7318 S Aberdeen St
- 7232 S Aberdeen St
- 1445 W 73rd St
- 7520 S May St
- 7144 S May St
- 7520 S Aberdeen St
- 7220 S Carpenter St
- 7545 S May St
- 7151 S Aberdeen St
- 7126 S Aberdeen St
- 7535 S Aberdeen St
- 7228 S Morgan St
- 7050 S Throop St
- 7335 S Morgan St
- 7411 S Morgan St
- 1259 W 73rd Place
- 1253 W 73rd Place
- 1251 W 73rd Place
- 1263 W 73rd Place
- 1249 W 73rd Place
- 1265 W 73rd Place
- 1247 W 73rd Place
- 1269 W 73rd Place
- 1243 W 73rd Place
- 1260 W 74th St
- 1250 W 74th St
- 1271 W 73rd Place
- 1241 W 73rd Place
- 1246 W 74th St
- 1252 W 74th St
- 1244 W 74th St
- 1264 W 74th St
- 1273 W 73rd Place
- 1239 W 73rd Place
- 1268 W 74th St