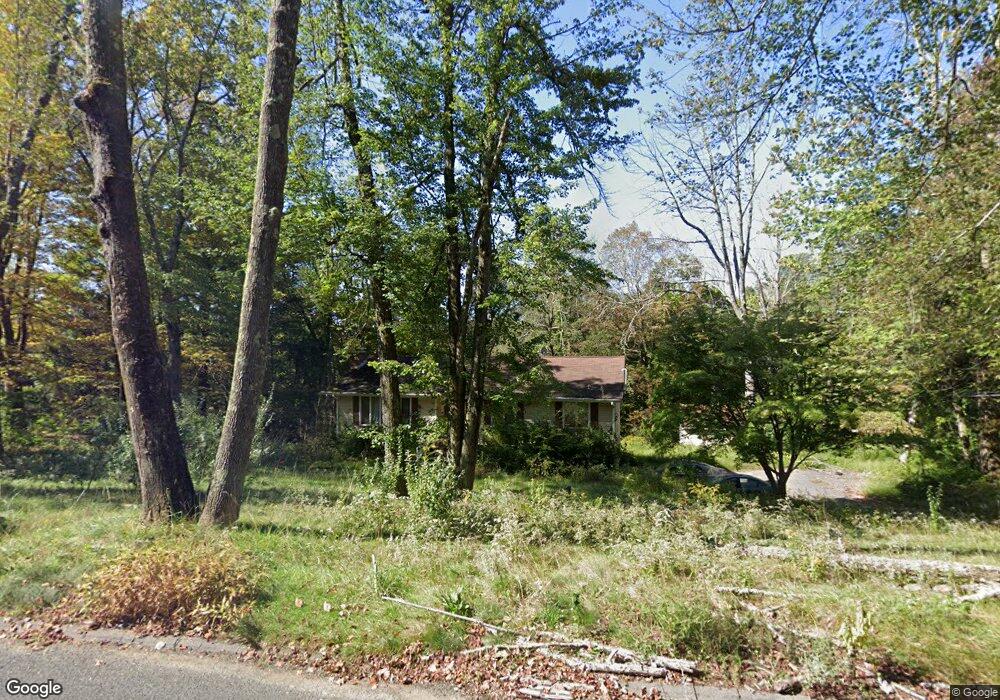
126 Hampden Rd Stafford Springs, CT 06076
Stafford NeighborhoodEstimated Value: $308,000 - $395,000
3
Beds
3
Baths
1,438
Sq Ft
$254/Sq Ft
Est. Value
About This Home
This home is located at 126 Hampden Rd, Stafford Springs, CT 06076 and is currently estimated at $365,594, approximately $254 per square foot. 126 Hampden Rd is a home located in Tolland County with nearby schools including Stafford Elementary School, Stafford Middle School, and Stafford High School.
Ownership History
Date
Name
Owned For
Owner Type
Purchase Details
Closed on
Dec 23, 2010
Sold by
Stebbins Richard T
Bought by
Davis Crystal J
Current Estimated Value
Home Financials for this Owner
Home Financials are based on the most recent Mortgage that was taken out on this home.
Original Mortgage
$149,250
Outstanding Balance
$98,355
Interest Rate
4.17%
Estimated Equity
$267,239
Purchase Details
Closed on
Jul 21, 2008
Sold by
Kupiec Marcia
Bought by
Stebbins Richard
Purchase Details
Closed on
May 16, 2007
Sold by
Cartus Financial Corp
Bought by
Kupiec Marcia
Purchase Details
Closed on
Jun 29, 2000
Sold by
Dabek Richard and Dabek Shelly
Bought by
Blaisdell Garry and Blaisdell Patricia
Purchase Details
Closed on
Apr 29, 1992
Sold by
Barber Douglass and Barber Lourdes
Bought by
Dabek Richard and Dabek Shelly
Create a Home Valuation Report for This Property
The Home Valuation Report is an in-depth analysis detailing your home's value as well as a comparison with similar homes in the area
Home Values in the Area
Average Home Value in this Area
Purchase History
| Date | Buyer | Sale Price | Title Company |
|---|---|---|---|
| Davis Crystal J | $199,000 | -- | |
| Stebbins Richard | $218,000 | -- | |
| Kupiec Marcia | $251,250 | -- | |
| Cartus Financial Corp | $252,250 | -- | |
| Blaisdell Garry | $159,900 | -- | |
| Dabek Richard | $137,000 | -- |
Source: Public Records
Mortgage History
| Date | Status | Borrower | Loan Amount |
|---|---|---|---|
| Open | Dabek Richard | $149,250 | |
| Previous Owner | Dabek Richard | $166,600 | |
| Previous Owner | Dabek Richard | $20,000 |
Source: Public Records
Tax History Compared to Growth
Tax History
| Year | Tax Paid | Tax Assessment Tax Assessment Total Assessment is a certain percentage of the fair market value that is determined by local assessors to be the total taxable value of land and additions on the property. | Land | Improvement |
|---|---|---|---|---|
| 2025 | $7,647 | $139,720 | $35,630 | $104,090 |
| 2024 | $5,392 | $139,720 | $35,630 | $104,090 |
| 2023 | $5,136 | $139,720 | $35,630 | $104,090 |
| 2022 | $4,999 | $139,720 | $35,630 | $104,090 |
| 2021 | $341 | $139,720 | $35,630 | $104,090 |
| 2020 | $341 | $132,370 | $37,660 | $94,710 |
| 2019 | $4,624 | $132,370 | $37,660 | $94,710 |
| 2018 | $4,535 | $132,370 | $37,660 | $94,710 |
| 2017 | $4,491 | $132,370 | $37,660 | $94,710 |
| 2016 | $4,436 | $132,370 | $37,660 | $94,710 |
| 2015 | $4,436 | $143,150 | $37,660 | $105,490 |
| 2014 | $4,728 | $143,150 | $37,660 | $105,490 |
Source: Public Records
Map
Nearby Homes
- 201 Diamond Ledge Rd
- 19 Potter Rd
- 5 Thomas Dr
- 188B W Stafford Rd
- 0 Rockledge Rd Unit 24131563
- 115 W Stafford Rd
- 93 Galbraith Rd
- 89 Crow Hill Rd
- 80 W Stafford Rd
- 81 Monson Rd
- 10 Laurel Ln
- 97 Orcuttville Rd
- 15 Deepwood Dr
- 1040 Main St
- 200 Orcuttville Rd
- 8 Gale Rd
- 1000 Main St
- 994 Main St
- 0 Stony Ln
- 73 Cooper Ln