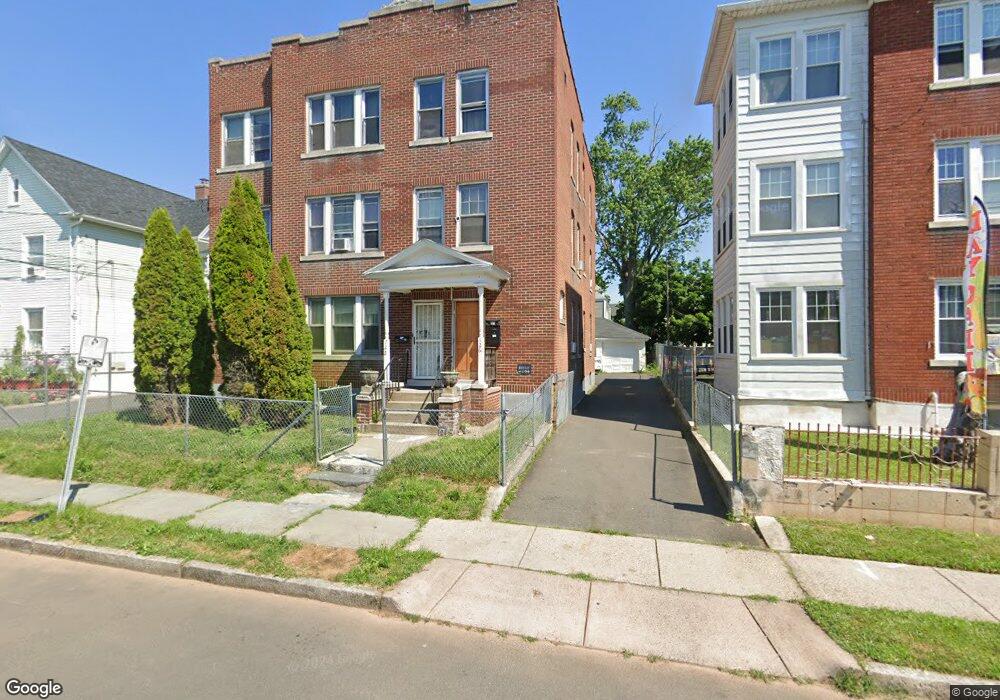
126 Standish St Unit 128 Hartford, CT 06114
South End NeighborhoodEstimated Value: $407,000 - $481,241
6
Beds
3
Baths
3,686
Sq Ft
$120/Sq Ft
Est. Value
About This Home
This home is located at 126 Standish St Unit 128, Hartford, CT 06114 and is currently estimated at $441,560, approximately $119 per square foot. 126 Standish St Unit 128 is a home located in Hartford County with nearby schools including Asian Studies School At Dwight/Belizzi School, Dr. James H Naylor/Ccsu Leadership Academy, and M. D. Fox School.
Ownership History
Date
Name
Owned For
Owner Type
Purchase Details
Closed on
Sep 27, 2006
Sold by
Qyra Aleko and Qyra Vitori
Bought by
Bhola Stanley and Bhola Guytri
Current Estimated Value
Home Financials for this Owner
Home Financials are based on the most recent Mortgage that was taken out on this home.
Original Mortgage
$209,300
Outstanding Balance
$124,662
Interest Rate
6.52%
Mortgage Type
Purchase Money Mortgage
Estimated Equity
$316,898
Purchase Details
Closed on
Feb 3, 2003
Sold by
Fontana Antonio and Fontana Maria
Bought by
Qyra Aleko and Qyra Vitori
Home Financials for this Owner
Home Financials are based on the most recent Mortgage that was taken out on this home.
Original Mortgage
$161,600
Interest Rate
6.09%
Mortgage Type
Purchase Money Mortgage
Create a Home Valuation Report for This Property
The Home Valuation Report is an in-depth analysis detailing your home's value as well as a comparison with similar homes in the area
Home Values in the Area
Average Home Value in this Area
Purchase History
| Date | Buyer | Sale Price | Title Company |
|---|---|---|---|
| Bhola Stanley | $299,000 | -- | |
| Qyra Aleko | $181,000 | -- |
Source: Public Records
Mortgage History
| Date | Status | Borrower | Loan Amount |
|---|---|---|---|
| Open | Qyra Aleko | $209,300 | |
| Previous Owner | Qyra Aleko | $35,000 | |
| Previous Owner | Qyra Aleko | $161,600 | |
| Previous Owner | Qyra Aleko | $12,670 |
Source: Public Records
Tax History Compared to Growth
Tax History
| Year | Tax Paid | Tax Assessment Tax Assessment Total Assessment is a certain percentage of the fair market value that is determined by local assessors to be the total taxable value of land and additions on the property. | Land | Improvement |
|---|---|---|---|---|
| 2025 | $7,006 | $101,614 | $10,547 | $91,067 |
| 2024 | $7,006 | $101,614 | $10,547 | $91,067 |
| 2023 | $7,006 | $101,614 | $10,547 | $91,067 |
| 2022 | $7,006 | $101,614 | $10,547 | $91,067 |
| 2021 | $4,691 | $63,140 | $13,825 | $49,315 |
| 2020 | $4,691 | $63,140 | $13,825 | $49,315 |
| 2019 | $4,691 | $63,140 | $13,825 | $49,315 |
| 2018 | $4,533 | $61,011 | $13,359 | $47,652 |
| 2016 | $4,188 | $56,368 | $12,723 | $43,645 |
| 2015 | $3,989 | $53,690 | $12,119 | $41,571 |
| 2014 | $3,891 | $52,378 | $11,823 | $40,555 |
Source: Public Records
Map
Nearby Homes
- 183 Preston St Unit 185
- 167 Campfield Ave
- 281 Brown St
- 839 Wethersfield Ave
- 326 South St Unit 328
- 126 Tredeau St
- 24 Stillman Rd
- 52 Stillman Rd
- 17 Bond St
- 15 Bond St
- 70 Stillman Rd
- 213 Franklin Ave Unit 405
- 69 Mountford St Unit 3A
- 73 Mountford St Unit 3B
- 77 Mountford St
- 405 W Preston St Unit 407
- 90 Harwich St Unit 92
- 147 Newbury St Unit 149
- 10 Warner St
- 50 Harwich St
- 122 Standish St Unit 124
- 118 Standish St Unit 120
- 121 Standish St
- 132 Standish St
- 114 Standish St
- 114 Standish St Unit 1E
- 127 Standish St
- 129 Standish St Unit 131
- 119 Standish St
- 134 Standish St Unit 136
- 112 Standish St
- 101 Brown St
- 115 Standish St Unit 117
- 111 Brown St Unit 113
- 95-97 Brown St
- 110 Standish St
- 135 Standish St
- 107 Brown St Unit 109
- 103 Brown St Unit 105