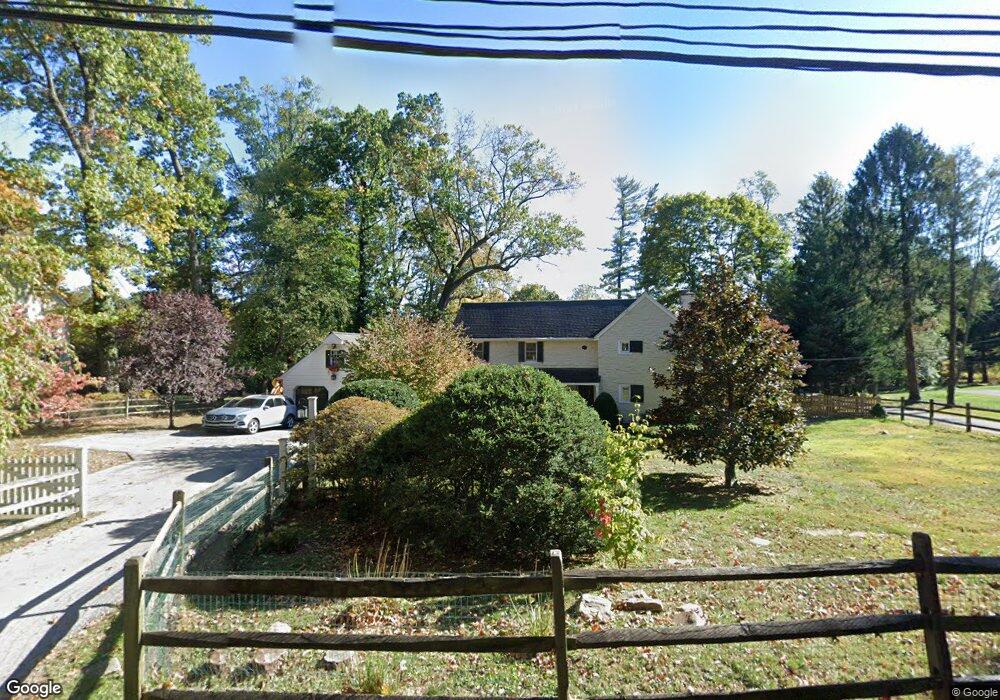
1260 Berwyn Paoli Rd Berwyn, PA 19312
Estimated Value: $990,000 - $1,182,000
3
Beds
3
Baths
2,834
Sq Ft
$376/Sq Ft
Est. Value
About This Home
This home is located at 1260 Berwyn Paoli Rd, Berwyn, PA 19312 and is currently estimated at $1,066,835, approximately $376 per square foot. 1260 Berwyn Paoli Rd is a home located in Chester County with nearby schools including Beaumont Elementary School, Tredyffrin-Easttown Middle School, and Conestoga Senior High School.
Ownership History
Date
Name
Owned For
Owner Type
Purchase Details
Closed on
Sep 5, 2001
Sold by
Graham Richard A and Graham Kimberly B
Bought by
Vandeweghe Kinsella Anne and Kinsella Matthew P
Current Estimated Value
Home Financials for this Owner
Home Financials are based on the most recent Mortgage that was taken out on this home.
Original Mortgage
$275,000
Outstanding Balance
$107,704
Interest Rate
7.05%
Estimated Equity
$959,131
Purchase Details
Closed on
Mar 29, 1995
Sold by
Chemical Bank
Bought by
Graham Richard A and Graham Kimberly B
Home Financials for this Owner
Home Financials are based on the most recent Mortgage that was taken out on this home.
Original Mortgage
$255,000
Interest Rate
8.49%
Purchase Details
Closed on
Oct 6, 1994
Sold by
Erling Robert A
Bought by
Chemical Bank
Create a Home Valuation Report for This Property
The Home Valuation Report is an in-depth analysis detailing your home's value as well as a comparison with similar homes in the area
Home Values in the Area
Average Home Value in this Area
Purchase History
| Date | Buyer | Sale Price | Title Company |
|---|---|---|---|
| Vandeweghe Kinsella Anne | $401,000 | -- | |
| Graham Richard A | $269,900 | -- | |
| Chemical Bank | -- | -- |
Source: Public Records
Mortgage History
| Date | Status | Borrower | Loan Amount |
|---|---|---|---|
| Open | Vandeweghe Kinsella Anne | $275,000 | |
| Previous Owner | Graham Richard A | $255,000 |
Source: Public Records
Tax History Compared to Growth
Tax History
| Year | Tax Paid | Tax Assessment Tax Assessment Total Assessment is a certain percentage of the fair market value that is determined by local assessors to be the total taxable value of land and additions on the property. | Land | Improvement |
|---|---|---|---|---|
| 2025 | $10,127 | $271,500 | $69,110 | $202,390 |
| 2024 | $10,127 | $271,500 | $69,110 | $202,390 |
| 2023 | $9,469 | $271,500 | $69,110 | $202,390 |
| 2022 | $9,210 | $271,500 | $69,110 | $202,390 |
| 2021 | $9,010 | $271,500 | $69,110 | $202,390 |
| 2020 | $8,759 | $271,500 | $69,110 | $202,390 |
| 2019 | $8,515 | $271,500 | $69,110 | $202,390 |
| 2018 | $8,368 | $271,500 | $69,110 | $202,390 |
| 2017 | $8,179 | $271,500 | $69,110 | $202,390 |
| 2016 | -- | $271,500 | $69,110 | $202,390 |
| 2015 | -- | $271,500 | $69,110 | $202,390 |
| 2014 | -- | $271,500 | $69,110 | $202,390 |
Source: Public Records
Map
Nearby Homes
- 32 Manchester Ct
- 1242 Old Lancaster Rd
- 1441 Berwyn Paoli Rd
- 5 Kent Ln
- 896 Conestoga Rd
- 91 Central Ave
- 327 Stoney Knoll Lane - Lot 5
- 211 Wooded Way
- 119 Waterloo Ave
- 520 Hawthorne Place
- 340 Beechwood Rd
- 553 Woodside Ave
- 521 Foxwood Ln
- 541 Woodside Ave
- 109 Vincent Rd
- 2102 Quail Ridge Dr
- 1304 Weatherstone Dr Unit 1304
- 1705 Weatherstone Dr
- 1602 Weatherstone Dr Unit 1602
- 2000 Saint Andrews Dr
- 1263 Berwyn Paoli Rd
- 1278 Berwyn Paoli Rd
- 1250 Berwyn Paoli Rd
- 116 Cherry Ln
- 1 Cherry Ln
- 1287 Berwyn Paoli Rd
- 1247 Berwyn Paoli Rd
- 1275 Berwyn Paoli Rd
- 2 Cherry Ln
- 21 Cartway Ln
- 1237 Berwyn Paoli Rd
- 122 Cherry Ln
- 1308 Berwyn Paoli Rd
- 22 Cartway Ln
- 1307 Berwyn Paoli Rd
- 107 Cherry Ln
- 1225 Berwyn Paoli Rd
- 113 Cherry Ln
- 119 Cherry Ln
- 26 Cartway Ln