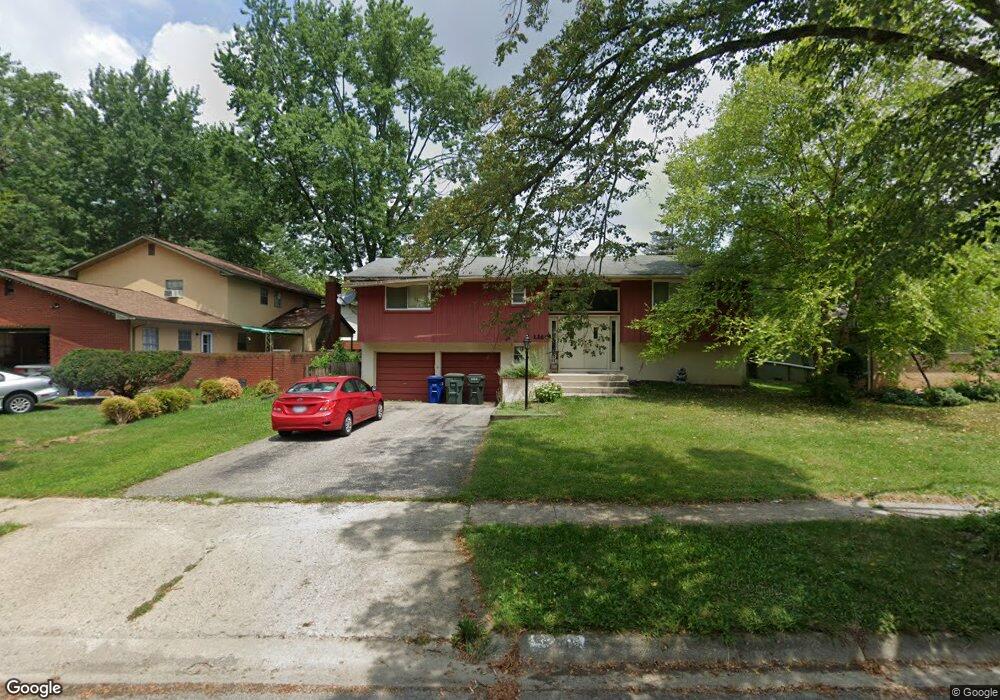
1260 Vinewood Dr Columbus, OH 43229
Forest Park West NeighborhoodEstimated Value: $283,008 - $336,000
4
Beds
2
Baths
1,664
Sq Ft
$184/Sq Ft
Est. Value
About This Home
This home is located at 1260 Vinewood Dr, Columbus, OH 43229 and is currently estimated at $306,002, approximately $183 per square foot. 1260 Vinewood Dr is a home located in Franklin County with nearby schools including Forest Park Elementary School, Woodward Park Middle School, and Northland High School.
Ownership History
Date
Name
Owned For
Owner Type
Purchase Details
Closed on
Feb 19, 2008
Sold by
Andi Andi and Sie Andi
Bought by
Downing Connie and Downing Stephen P
Current Estimated Value
Home Financials for this Owner
Home Financials are based on the most recent Mortgage that was taken out on this home.
Original Mortgage
$154,550
Outstanding Balance
$94,202
Interest Rate
5.51%
Mortgage Type
FHA
Estimated Equity
$211,800
Purchase Details
Closed on
Jun 28, 2001
Sold by
Rice Charles E and Rice Mary P
Bought by
Andi Andi
Home Financials for this Owner
Home Financials are based on the most recent Mortgage that was taken out on this home.
Original Mortgage
$107,900
Interest Rate
7.27%
Mortgage Type
Purchase Money Mortgage
Purchase Details
Closed on
Jul 31, 1986
Bought by
Rice Ii Charles E
Purchase Details
Closed on
Feb 1, 1985
Purchase Details
Closed on
Jun 1, 1983
Create a Home Valuation Report for This Property
The Home Valuation Report is an in-depth analysis detailing your home's value as well as a comparison with similar homes in the area
Home Values in the Area
Average Home Value in this Area
Purchase History
| Date | Buyer | Sale Price | Title Company |
|---|---|---|---|
| Downing Connie | $157,000 | Arrow Title | |
| Andi Andi | $119,900 | Title First Agency Inc | |
| Rice Ii Charles E | $67,500 | -- | |
| -- | -- | -- | |
| -- | $61,000 | -- |
Source: Public Records
Mortgage History
| Date | Status | Borrower | Loan Amount |
|---|---|---|---|
| Open | Downing Connie | $154,550 | |
| Previous Owner | Andi Andi | $107,900 |
Source: Public Records
Tax History Compared to Growth
Tax History
| Year | Tax Paid | Tax Assessment Tax Assessment Total Assessment is a certain percentage of the fair market value that is determined by local assessors to be the total taxable value of land and additions on the property. | Land | Improvement |
|---|---|---|---|---|
| 2024 | $3,575 | $79,660 | $20,370 | $59,290 |
| 2023 | $3,529 | $79,660 | $20,370 | $59,290 |
| 2022 | $2,640 | $50,900 | $11,380 | $39,520 |
| 2021 | $2,645 | $50,900 | $11,380 | $39,520 |
| 2020 | $2,648 | $50,900 | $11,380 | $39,520 |
| 2019 | $2,493 | $41,090 | $9,100 | $31,990 |
| 2018 | $2,302 | $41,090 | $9,100 | $31,990 |
| 2017 | $2,491 | $41,090 | $9,100 | $31,990 |
| 2016 | $2,332 | $35,210 | $8,540 | $26,670 |
| 2015 | $2,117 | $35,210 | $8,540 | $26,670 |
| 2014 | $2,122 | $35,210 | $8,540 | $26,670 |
| 2013 | $1,102 | $37,065 | $8,995 | $28,070 |
Source: Public Records
Map
Nearby Homes
- 5415 Vinewood Ct
- 5480 Rockwood Ct Unit R1
- 1493 Boxwood Dr
- 5318 Eisenhower Rd
- 5579 Norcross Rd
- 5231 Arrowood Ct
- 1385 Thurell Rd
- 964 Strimple Ave
- 1492 Cottonwood Dr
- 4983 Almont Dr
- 1485 Norma Rd
- 5650 N Meadows Blvd
- 5022 Sienna Ln
- 1704 Riverbirch Dr
- 4904 Almont Dr
- 4923 Karl Rd Unit 4925
- 1414 Alvina Dr
- 1722 Blue Ash Place
- 4852 Colonel Perry Dr
- 4840 Almont Dr
- 1270 Vinewood Dr
- 5390 Willowwood Rd
- 1263 Gumwood Dr
- 1280 Vinewood Dr
- 1273 Gumwood Dr
- 5406 Willowwood Rd
- 1265 Vinewood Dr
- 1263 Vinewood Dr
- 1281 Gumwood Dr
- 1279 Vinewood Dr
- 1300 Vinewood Dr
- 1247 Vinewood Dr
- 1287 Vinewood Dr
- 0 Willowwood Rd
- 5399 Willowwood Rd
- 1240 Vinewood Dr
- 1291 Gumwood Dr
- 1241 Vinewood Dr
- 5405 Willowwood Rd
- 1297 Vinewood Dr