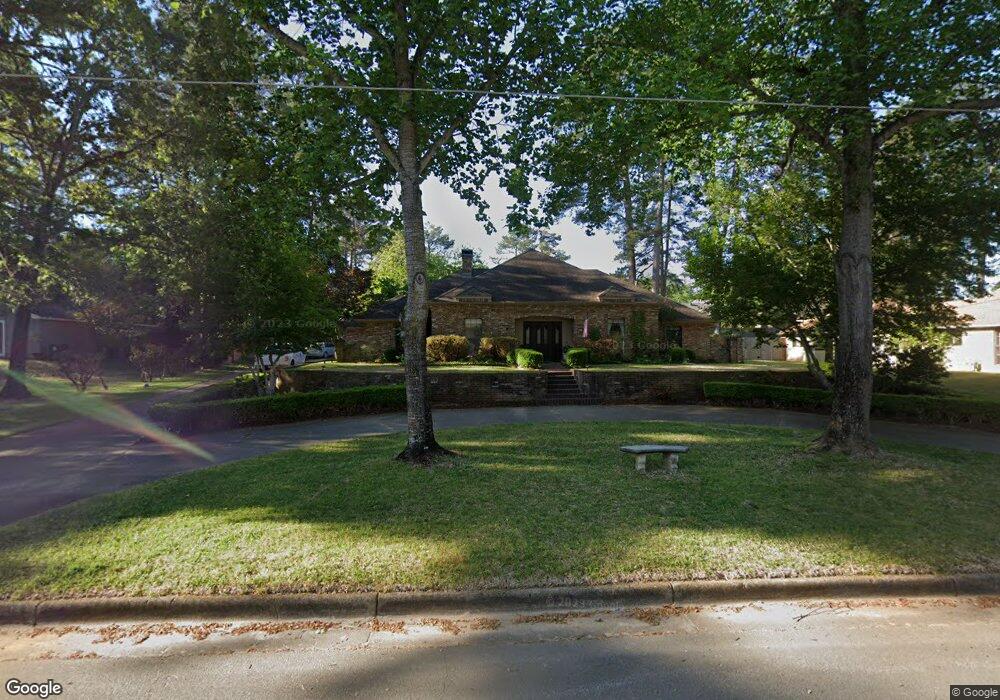
1261 Old Hickory Rd Tyler, TX 75703
The Cumberland Estates NeighborhoodEstimated Value: $432,000 - $516,000
3
Beds
3
Baths
2,458
Sq Ft
$187/Sq Ft
Est. Value
About This Home
This home is located at 1261 Old Hickory Rd, Tyler, TX 75703 and is currently estimated at $460,164, approximately $187 per square foot. 1261 Old Hickory Rd is a home located in Smith County with nearby schools including Stanton-Smith Elementary School, J.W. Holloway Sixth Grade School, and Whitehouse High School.
Ownership History
Date
Name
Owned For
Owner Type
Purchase Details
Closed on
Feb 20, 2018
Sold by
Mcleod James D and Mcleod Marcy Wynne
Bought by
Roberts Teresa and Roberts Gary
Current Estimated Value
Home Financials for this Owner
Home Financials are based on the most recent Mortgage that was taken out on this home.
Original Mortgage
$189,000
Outstanding Balance
$159,697
Interest Rate
3.99%
Mortgage Type
New Conventional
Estimated Equity
$300,467
Purchase Details
Closed on
May 31, 2007
Sold by
Lockett Mary L and Lockett Mary Louise
Bought by
Mcleod James D and Mcleod Marcy Wynne
Home Financials for this Owner
Home Financials are based on the most recent Mortgage that was taken out on this home.
Original Mortgage
$151,400
Interest Rate
6.17%
Mortgage Type
Purchase Money Mortgage
Create a Home Valuation Report for This Property
The Home Valuation Report is an in-depth analysis detailing your home's value as well as a comparison with similar homes in the area
Home Values in the Area
Average Home Value in this Area
Purchase History
| Date | Buyer | Sale Price | Title Company |
|---|---|---|---|
| Roberts Teresa | -- | None Available | |
| Mcleod James D | -- | None Available |
Source: Public Records
Mortgage History
| Date | Status | Borrower | Loan Amount |
|---|---|---|---|
| Open | Roberts Teresa | $189,000 | |
| Previous Owner | Mcleod James D | $151,400 |
Source: Public Records
Tax History Compared to Growth
Tax History
| Year | Tax Paid | Tax Assessment Tax Assessment Total Assessment is a certain percentage of the fair market value that is determined by local assessors to be the total taxable value of land and additions on the property. | Land | Improvement |
|---|---|---|---|---|
| 2025 | $2,663 | $564,733 | $107,475 | $457,258 |
| 2024 | $2,663 | $405,350 | $59,892 | $462,060 |
| 2023 | $5,610 | $400,925 | $59,892 | $341,033 |
| 2022 | $5,844 | $345,233 | $44,919 | $300,314 |
| 2021 | $5,691 | $304,545 | $44,919 | $259,626 |
| 2020 | $5,354 | $277,398 | $42,823 | $234,575 |
| 2019 | $5,479 | $274,688 | $42,823 | $231,865 |
| 2018 | $4,350 | $256,163 | $29,946 | $226,217 |
| 2017 | $3,496 | $199,433 | $29,946 | $169,487 |
| 2016 | $3,548 | $202,380 | $29,946 | $172,434 |
| 2015 | $3,135 | $197,955 | $29,946 | $168,009 |
| 2014 | $3,135 | $192,535 | $29,946 | $162,589 |
Source: Public Records
Map
Nearby Homes
- 1261 Luann Ln
- 1266 Santa fe Trail
- 9211 Elm Tree Cir
- 1242 Rainmaker
- 1242 Colt Ln
- 1211 Centennial Trail
- 1625 Skidmore Ln
- 1633 Legacy Ct
- 8811 Wilder Trail
- 8831 Wilder Trail
- 8714 Wilder Trail
- 8702 Wilder Trail
- 8741 Wilder Trail
- 629 Winding Brook Ln
- 8810 Wilder Trail
- 9214 Stonebank Crossing
- 533 Skipping Stone Ln
- 533 Stepping Stone Ln
- 9231 Villas Ct
- 9256 Villas Ct
- 1261 1261 Old Hickory Rd
- 1277 Old Hickory Rd
- 1239 Old Hickory Rd
- 1277 1277 Old Hickory Rd
- 1266 Luann Ln
- 1278 Luann Ln
- 1236 Luann Ln
- 1266 Old Hickory Rd
- 1221 1221 Old Hickory Rd
- 1305 Old Hickory Rd
- 1221 Old Hickory Rd
- 1278 Old Hickory Rd
- 1302 Luann Ln
- 1228 Luann Ln
- 1228 1228 Luann Ln
- 1302 1302 Luann Ln
- 1302 1302 Old Hickory
- 1218 1218 Old Hickory Rd
- 1218 Old Hickory Rd
- 1327 Old Hickory Rd