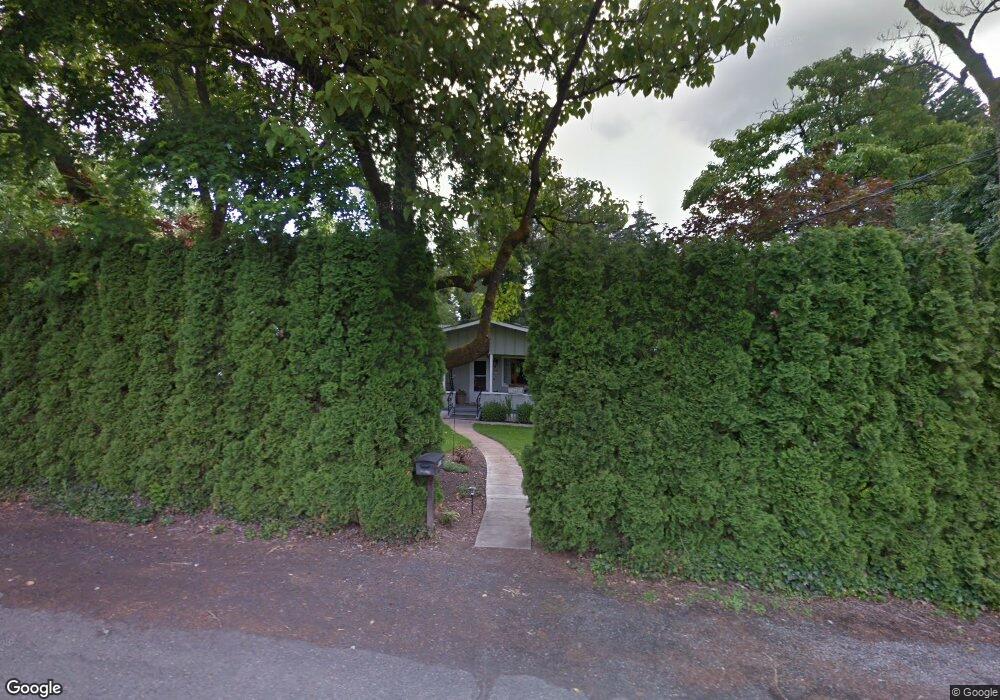
12611 NE 20th Ave Vancouver, WA 98686
Estimated Value: $538,000 - $632,000
4
Beds
2
Baths
2,478
Sq Ft
$239/Sq Ft
Est. Value
About This Home
This home is located at 12611 NE 20th Ave, Vancouver, WA 98686 and is currently estimated at $593,180, approximately $239 per square foot. 12611 NE 20th Ave is a home located in Clark County with nearby schools including Salmon Creek Elementary School, Alki Middle School, and Skyview High School.
Ownership History
Date
Name
Owned For
Owner Type
Purchase Details
Closed on
Dec 26, 2018
Sold by
Wishman Steven Allen
Bought by
Wishman Steven Allen and Steven A Wishman 2010 Living Trust
Current Estimated Value
Purchase Details
Closed on
Mar 1, 2017
Sold by
Malvini Denice
Bought by
Wishman Steven Allen and Wishman Emily Kavanagh
Purchase Details
Closed on
Mar 24, 2016
Sold by
Malvini Denise and Fugere Denice A
Bought by
Malvini Denise
Home Financials for this Owner
Home Financials are based on the most recent Mortgage that was taken out on this home.
Original Mortgage
$235,000
Interest Rate
3.62%
Mortgage Type
VA
Purchase Details
Closed on
Jan 16, 2014
Sold by
Fugere Denice A and Fugere David
Bought by
Fugere Denice A
Purchase Details
Closed on
Feb 1, 2013
Sold by
Fuger Danice A and Malvini Denise Antoinette
Bought by
Fugere Denise A and Fugere David
Purchase Details
Closed on
Mar 23, 2010
Sold by
Marsh Jeffrey W
Bought by
Malvini Denice Antoinette
Home Financials for this Owner
Home Financials are based on the most recent Mortgage that was taken out on this home.
Original Mortgage
$230,000
Interest Rate
4.94%
Mortgage Type
VA
Purchase Details
Closed on
Nov 6, 2009
Sold by
Hsbc Bank Usa National Association
Bought by
Marsh Jeffrey W
Purchase Details
Closed on
Jun 15, 2009
Sold by
Wilson Richard C and Jackson Cathie E
Bought by
Hsbc Bank Usa National Association
Purchase Details
Closed on
Sep 2, 2005
Sold by
Pitner Vearl B and Pitner Pauline
Bought by
Primogenitor Corp
Home Financials for this Owner
Home Financials are based on the most recent Mortgage that was taken out on this home.
Original Mortgage
$48,000
Interest Rate
5.7%
Mortgage Type
Stand Alone Second
Purchase Details
Closed on
Aug 30, 2005
Sold by
Primogenitor Corp
Bought by
Wilson Richard C and Jackson Cathie E
Home Financials for this Owner
Home Financials are based on the most recent Mortgage that was taken out on this home.
Original Mortgage
$48,000
Interest Rate
5.7%
Mortgage Type
Stand Alone Second
Purchase Details
Closed on
Apr 15, 2002
Sold by
Pitner Vearl B and Pitner Pauline
Bought by
Primogenitor Corp
Home Financials for this Owner
Home Financials are based on the most recent Mortgage that was taken out on this home.
Original Mortgage
$87,000
Interest Rate
10%
Purchase Details
Closed on
May 21, 2001
Sold by
Elorza Eli and Elorza Elizabeth
Bought by
Pitner Vearl B and Pitner Pauline
Create a Home Valuation Report for This Property
The Home Valuation Report is an in-depth analysis detailing your home's value as well as a comparison with similar homes in the area
Home Values in the Area
Average Home Value in this Area
Purchase History
| Date | Buyer | Sale Price | Title Company |
|---|---|---|---|
| Wishman Steven Allen | -- | None Available | |
| Wishman Steven Allen | -- | None Available | |
| Wishman Steven Allen | $325,000 | Fidelity Title Dt Vancouver | |
| Malvini Denise | -- | None Available | |
| Fugere Denice A | -- | Clark County Title Co | |
| Fugere Denise A | -- | Clark County Title Co | |
| Malvini Denice Antoinette | $230,000 | Clark County Title Co | |
| Marsh Jeffrey W | $135,000 | Accommodation | |
| Hsbc Bank Usa National Association | $208,250 | Chicago Title | |
| Primogenitor Corp | -- | Fidelity National Title | |
| Wilson Richard C | $240,000 | Fidelity National Title | |
| Primogenitor Corp | $88,000 | Clark County Title Company | |
| Pitner Vearl B | -- | -- |
Source: Public Records
Mortgage History
| Date | Status | Borrower | Loan Amount |
|---|---|---|---|
| Previous Owner | Malvini Denise | $235,000 | |
| Previous Owner | Malvini Denice Antoinette | $230,000 | |
| Previous Owner | Wilson Richard C | $48,000 | |
| Previous Owner | Wilson Richard C | $192,000 | |
| Previous Owner | Primogenitor Corp | $87,000 |
Source: Public Records
Tax History Compared to Growth
Tax History
| Year | Tax Paid | Tax Assessment Tax Assessment Total Assessment is a certain percentage of the fair market value that is determined by local assessors to be the total taxable value of land and additions on the property. | Land | Improvement |
|---|---|---|---|---|
| 2025 | $5,611 | $558,772 | $178,946 | $379,826 |
| 2024 | $5,132 | $533,310 | $178,946 | $354,364 |
| 2023 | $4,891 | $527,119 | $186,355 | $340,764 |
| 2022 | $4,922 | $498,081 | $175,241 | $322,840 |
| 2021 | $4,641 | $446,818 | $164,601 | $282,217 |
| 2020 | $4,185 | $395,249 | $146,204 | $249,045 |
| 2019 | $3,938 | $378,664 | $146,204 | $232,460 |
| 2018 | $4,288 | $369,955 | $0 | $0 |
| 2017 | $3,696 | $337,026 | $0 | $0 |
| 2016 | $3,409 | $302,550 | $0 | $0 |
| 2015 | $3,326 | $260,764 | $0 | $0 |
| 2014 | -- | $245,632 | $0 | $0 |
| 2013 | -- | $209,623 | $0 | $0 |
Source: Public Records
Map
Nearby Homes
- 12445 NE Plantation Rd
- 2729 NE 125th St
- 1312 NE 131st Cir
- 12704 NE 11th Place
- 13216 NE Salmon Creek Ave Unit R-3
- 13216 NE Salmon Creek Ave Unit J1
- 12215 NE Salmon Creek Ave
- 1715 NE 116th St
- 12800 NE Salmon Creek Ave Unit 119
- 18009 NE 46th Ct
- 11313 NE Highway 99
- 13912 NE 23rd Ave
- 13915 NE 23rd Ave
- 3404 NE 128th St
- 911 NE Tenney Rd
- 1611 NE 113th St Unit 421
- 1611 NE 113th St
- 1621 NE 113th St Unit 132
- 2202 NE 140th St
- 2202 NE 140th St Unit Lot 44
- 12701 NE 20th Ave
- 12601 NE 20th Ave
- 12607 NE 20th Ave
- 12703 NE 20th Ave
- 6220 NE 121st Way
- 6224 NE 121st Way
- 6216 NE 121st Way
- 12512 NE 20th Ave
- 12603 NE 20th Ave
- 12516 NE 23rd Ave
- 12514 NE 23rd Ave
- 12518 NE 23rd Ave
- 12510 NE 23rd Ave
- 12600 NE 23rd Ave
- 12517 NE 20th Ave
- 12508 NE 23rd Ave
- 12702 NE 23rd Ave
- 12506 NE 23rd Ave
- 12504 NE 23rd Ave
- 12704 NE 23rd Ave