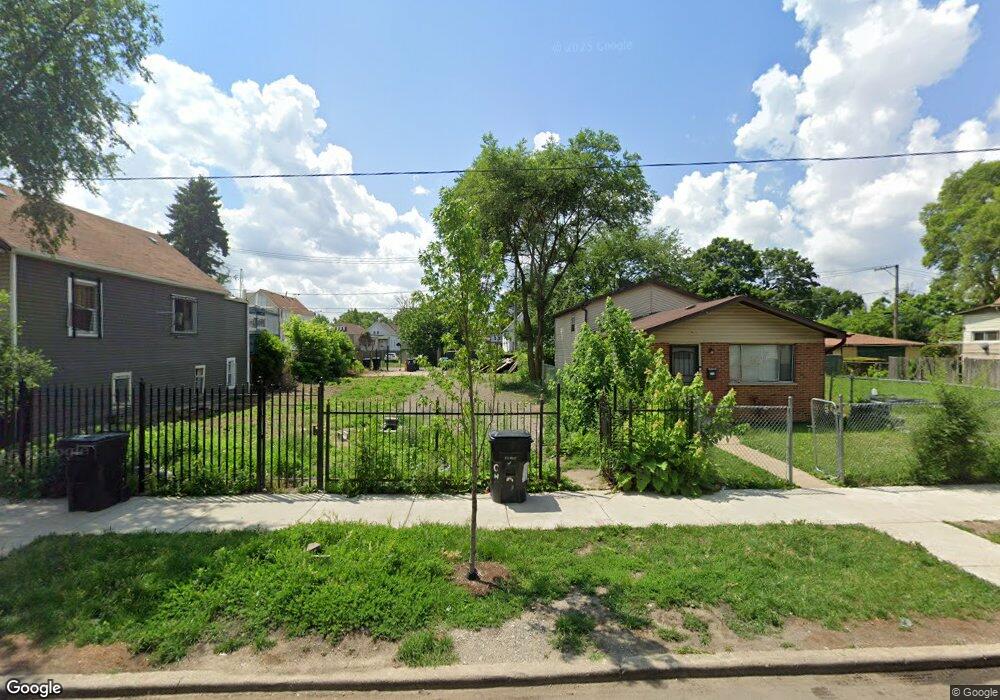
1263 W 73rd Place Chicago, IL 60636
Englewood NeighborhoodEstimated Value: $77,207 - $212,000
2
Beds
1
Bath
651
Sq Ft
$209/Sq Ft
Est. Value
About This Home
This home is located at 1263 W 73rd Place, Chicago, IL 60636 and is currently estimated at $135,802, approximately $208 per square foot. 1263 W 73rd Place is a home located in Cook County with nearby schools including Stagg Elementary School, Bogan Computer Technical High School, and St Sabina Academy.
Ownership History
Date
Name
Owned For
Owner Type
Purchase Details
Closed on
Jan 27, 2017
Sold by
David Tod Corp
Bought by
Thomas Anzie
Current Estimated Value
Purchase Details
Closed on
Dec 18, 1996
Sold by
Cwik David L
Bought by
David Tod Corp
Home Financials for this Owner
Home Financials are based on the most recent Mortgage that was taken out on this home.
Original Mortgage
$41,250
Interest Rate
7.74%
Mortgage Type
Balloon
Purchase Details
Closed on
Dec 9, 1996
Sold by
David Tod Corp
Bought by
Cwik David L
Home Financials for this Owner
Home Financials are based on the most recent Mortgage that was taken out on this home.
Original Mortgage
$41,250
Interest Rate
7.74%
Mortgage Type
Balloon
Purchase Details
Closed on
Sep 24, 1996
Sold by
Hud
Bought by
David Tod Corp
Purchase Details
Closed on
Dec 10, 1993
Sold by
Standard Bank & Trust Company
Bought by
Harris Alvin E
Home Financials for this Owner
Home Financials are based on the most recent Mortgage that was taken out on this home.
Original Mortgage
$52,300
Interest Rate
7.35%
Mortgage Type
FHA
Create a Home Valuation Report for This Property
The Home Valuation Report is an in-depth analysis detailing your home's value as well as a comparison with similar homes in the area
Home Values in the Area
Average Home Value in this Area
Purchase History
| Date | Buyer | Sale Price | Title Company |
|---|---|---|---|
| Thomas Anzie | -- | Attorney | |
| David Tod Corp | -- | Prairie Title | |
| Cwik David L | -- | Prairie Title | |
| David Tod Corp | -- | -- | |
| Harris Alvin E | $34,666 | -- |
Source: Public Records
Mortgage History
| Date | Status | Borrower | Loan Amount |
|---|---|---|---|
| Previous Owner | Cwik David L | $41,250 | |
| Previous Owner | Harris Alvin E | $52,300 |
Source: Public Records
Tax History Compared to Growth
Tax History
| Year | Tax Paid | Tax Assessment Tax Assessment Total Assessment is a certain percentage of the fair market value that is determined by local assessors to be the total taxable value of land and additions on the property. | Land | Improvement |
|---|---|---|---|---|
| 2024 | -- | $3,401 | $938 | $2,463 |
| 2023 | -- | $3,316 | $2,031 | $1,285 |
| 2022 | $0 | $3,316 | $2,031 | $1,285 |
| 2021 | $402 | $3,316 | $2,031 | $1,285 |
| 2020 | $402 | $4,905 | $2,343 | $2,562 |
| 2019 | $406 | $5,450 | $2,343 | $3,107 |
| 2018 | $398 | $5,450 | $2,343 | $3,107 |
| 2017 | $879 | $7,460 | $2,031 | $5,429 |
| 2016 | $994 | $7,460 | $2,031 | $5,429 |
| 2015 | $886 | $7,460 | $2,031 | $5,429 |
| 2014 | $763 | $6,679 | $1,875 | $4,804 |
| 2013 | $736 | $6,679 | $1,875 | $4,804 |
Source: Public Records
Map
Nearby Homes
- 1244 W 74th Place
- 7300 S Racine Ave
- 1241 W 72nd Place
- 7238 S May St
- 7342 S Aberdeen St
- 7318 S Aberdeen St
- 7232 S Aberdeen St
- 1445 W 73rd St
- 7520 S May St
- 7144 S May St
- 7520 S Aberdeen St
- 7220 S Carpenter St
- 7545 S May St
- 7151 S Aberdeen St
- 7126 S Aberdeen St
- 7535 S Aberdeen St
- 7228 S Morgan St
- 7050 S Throop St
- 7335 S Morgan St
- 7411 S Morgan St
- 1265 W 73rd Place
- 1269 W 73rd Place
- 1259 W 73rd Place
- 1271 W 73rd Place
- 1255 W 73rd Place
- 1273 W 73rd Place
- 1253 W 73rd Place
- 1251 W 73rd Place
- 1264 W 74th St
- 1260 W 74th St
- 1268 W 74th St
- 1279 W 73rd Place
- 1249 W 73rd Place
- 1281 W 73rd Place
- 1247 W 73rd Place
- 1252 W 74th St
- 1250 W 74th St
- 1264 W 73rd Place
- 1268 W 73rd Place
- 1256 W 73rd Place