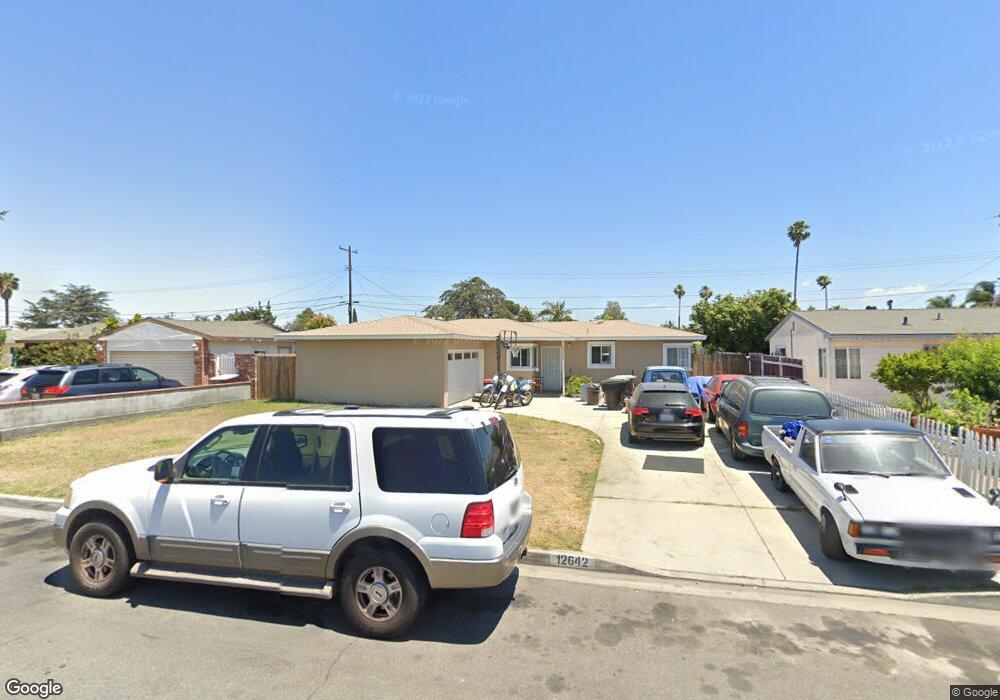
12642 Sweetbriar Dr Garden Grove, CA 92840
Estimated Value: $806,000 - $969,000
4
Beds
2
Baths
1,119
Sq Ft
$804/Sq Ft
Est. Value
About This Home
This home is located at 12642 Sweetbriar Dr, Garden Grove, CA 92840 and is currently estimated at $899,613, approximately $803 per square foot. 12642 Sweetbriar Dr is a home located in Orange County with nearby schools including Earl Warren Elementary School, Izaak Walton Intermediate School, and Santiago High School.
Ownership History
Date
Name
Owned For
Owner Type
Purchase Details
Closed on
Dec 23, 2019
Sold by
Meagher Elaine Louise and Elmer Thomas Meagher Family Tr
Bought by
Meagher Elaine Louise and Meagher Family Survivor S Trus
Current Estimated Value
Purchase Details
Closed on
Jun 28, 2013
Sold by
Meagher Elmer T and Meagher Elaine L
Bought by
Meagher Elmer Thomas and Meagher Elaine Louise
Home Financials for this Owner
Home Financials are based on the most recent Mortgage that was taken out on this home.
Original Mortgage
$259,000
Interest Rate
3.57%
Mortgage Type
New Conventional
Purchase Details
Closed on
Jun 19, 1997
Sold by
Wright Stephen D and Wright Elmer T
Bought by
Meagher Elmer Thomas and Meagher Elaine Louise
Home Financials for this Owner
Home Financials are based on the most recent Mortgage that was taken out on this home.
Original Mortgage
$57,713
Interest Rate
7.92%
Mortgage Type
Seller Take Back
Create a Home Valuation Report for This Property
The Home Valuation Report is an in-depth analysis detailing your home's value as well as a comparison with similar homes in the area
Home Values in the Area
Average Home Value in this Area
Purchase History
| Date | Buyer | Sale Price | Title Company |
|---|---|---|---|
| Meagher Elaine Louise | -- | Accommodation | |
| Meagher Elmer Thomas | -- | Lsi Title | |
| Meagher Elmer T | -- | Lsi Title | |
| Meagher Elmer Thomas | -- | Fidelity National Title Ins |
Source: Public Records
Mortgage History
| Date | Status | Borrower | Loan Amount |
|---|---|---|---|
| Closed | Meagher Elmer T | $259,000 | |
| Closed | Meagher Elmer Thomas | $57,713 |
Source: Public Records
Tax History Compared to Growth
Tax History
| Year | Tax Paid | Tax Assessment Tax Assessment Total Assessment is a certain percentage of the fair market value that is determined by local assessors to be the total taxable value of land and additions on the property. | Land | Improvement |
|---|---|---|---|---|
| 2025 | $2,461 | $173,259 | $117,485 | $55,774 |
| 2024 | $2,461 | $169,862 | $115,181 | $54,681 |
| 2023 | $2,413 | $166,532 | $112,923 | $53,609 |
| 2022 | $2,359 | $163,267 | $110,709 | $52,558 |
| 2021 | $2,327 | $160,066 | $108,538 | $51,528 |
| 2020 | $2,300 | $158,425 | $107,425 | $51,000 |
| 2019 | $2,272 | $155,319 | $105,319 | $50,000 |
| 2018 | $2,220 | $152,274 | $103,254 | $49,020 |
| 2017 | $2,197 | $149,289 | $101,230 | $48,059 |
| 2016 | $2,097 | $146,362 | $99,245 | $47,117 |
| 2015 | $2,070 | $144,164 | $97,754 | $46,410 |
| 2014 | $2,023 | $141,341 | $95,840 | $45,501 |
Source: Public Records
Map
Nearby Homes
- 12621 Sweetbriar Dr
- 12691 Sweetbriar Dr
- 12842 Palm St Unit 108
- 12850 Palm St Unit 6
- 12722 Aspenwood Ln
- 12812 Timber Rd Unit 22
- 12848 Timber Rd Unit 33
- 12905 Palm St
- 12222 Emrys Ave
- 12414 Fallingleaf St
- 13096 Blackbird St Unit 82
- 13096 Blackbird St Unit 11
- 13096 Blackbird St Unit 164
- 13096 Blackbird St Unit 67
- 12342 Quartz Place
- 13102 Partridge St Unit 7
- 13102 Partridge St Unit 54
- 12071 Acacia Ave
- 12560 Haster St Unit 204
- 12560 Haster St Unit 205
- 12662 Sweetbriar Dr
- 12632 Sweetbriar Dr
- 12641 Chaparral Dr
- 12661 Chaparral Dr Unit 1
- 12661 Chaparral Dr
- 12631 Chaparral Dr
- 12672 Sweetbriar Dr
- 12622 Sweetbriar Dr
- 12641 Sweetbriar Dr
- 12671 Chaparral Dr
- 12621 Chaparral Dr
- 12661 Sweetbriar Dr
- 12631 Sweetbriar Dr
- 12692 Sweetbriar Dr
- 12612 Sweetbriar Dr
- 12671 Sweetbriar Dr
- 12691 Chaparral Dr
- 12611 Chaparral Dr
- 12611 Sweetbriar Dr
- 12602 Sweetbriar Dr