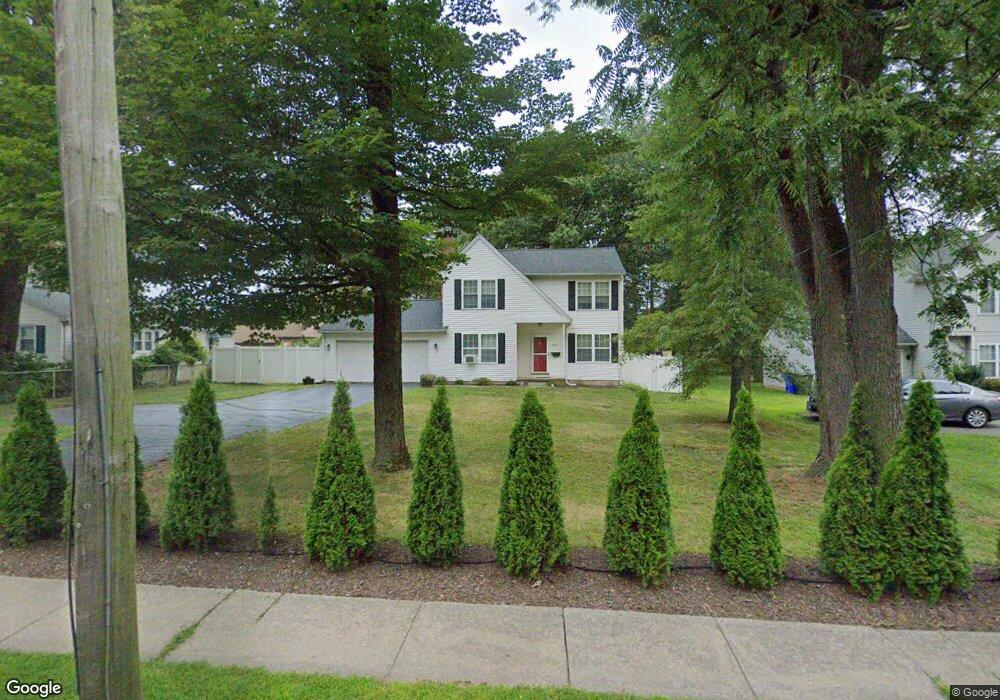
1265 N Main St West Hartford, CT 06117
Estimated Value: $424,000 - $518,000
3
Beds
3
Baths
1,536
Sq Ft
$305/Sq Ft
Est. Value
About This Home
This home is located at 1265 N Main St, West Hartford, CT 06117 and is currently estimated at $469,105, approximately $305 per square foot. 1265 N Main St is a home located in Hartford County with nearby schools including Norfeldt School, King Philip Middle School, and Hall High School.
Ownership History
Date
Name
Owned For
Owner Type
Purchase Details
Closed on
Sep 17, 2008
Sold by
Lostocco David and Lostocco Carolyn
Bought by
Sharp Adam K and Sharp Amanda D
Current Estimated Value
Home Financials for this Owner
Home Financials are based on the most recent Mortgage that was taken out on this home.
Original Mortgage
$226,000
Interest Rate
6.54%
Purchase Details
Closed on
Dec 23, 1993
Sold by
Vosburgh Jonathan and Brown Eric
Bought by
Lostocco David and Lostocco Carolyn
Home Financials for this Owner
Home Financials are based on the most recent Mortgage that was taken out on this home.
Original Mortgage
$141,830
Interest Rate
7%
Mortgage Type
Unknown
Purchase Details
Closed on
Aug 31, 1993
Sold by
Lupo John Est
Bought by
Vosburg Jonathan and Brown Eric
Create a Home Valuation Report for This Property
The Home Valuation Report is an in-depth analysis detailing your home's value as well as a comparison with similar homes in the area
Home Values in the Area
Average Home Value in this Area
Purchase History
| Date | Buyer | Sale Price | Title Company |
|---|---|---|---|
| Sharp Adam K | $282,500 | -- | |
| Lostocco David | $152,000 | -- | |
| Vosburg Jonathan | $50,000 | -- |
Source: Public Records
Mortgage History
| Date | Status | Borrower | Loan Amount |
|---|---|---|---|
| Open | Vosburg Jonathan | $221,000 | |
| Closed | Vosburg Jonathan | $226,000 | |
| Previous Owner | Vosburg Jonathan | $127,300 | |
| Previous Owner | Vosburg Jonathan | $141,830 |
Source: Public Records
Tax History Compared to Growth
Tax History
| Year | Tax Paid | Tax Assessment Tax Assessment Total Assessment is a certain percentage of the fair market value that is determined by local assessors to be the total taxable value of land and additions on the property. | Land | Improvement |
|---|---|---|---|---|
| 2025 | $9,528 | $212,780 | $69,000 | $143,780 |
| 2024 | $9,011 | $212,780 | $69,000 | $143,780 |
| 2023 | $8,707 | $212,780 | $69,000 | $143,780 |
| 2022 | $8,656 | $212,780 | $69,000 | $143,780 |
| 2021 | $7,982 | $188,160 | $66,300 | $121,860 |
| 2020 | $7,865 | $188,160 | $60,400 | $127,760 |
| 2019 | $7,865 | $188,160 | $60,410 | $127,750 |
| 2018 | $7,715 | $188,160 | $60,410 | $127,750 |
| 2017 | $7,722 | $188,160 | $60,410 | $127,750 |
| 2016 | $7,379 | $186,760 | $57,470 | $129,290 |
| 2015 | $7,155 | $186,760 | $57,470 | $129,290 |
| 2014 | $6,801 | $182,000 | $57,470 | $124,530 |
Source: Public Records
Map
Nearby Homes
- 365 Simsbury Rd
- 94 Richmond Ln
- 148 King Philip Dr
- 17 Cranbrook
- 36 Richmond Ln
- 21 Barksdale Rd
- 30 Biltmore Park Unit 30
- 537 Bloomfield Ave
- 645 Bloomfield Ave
- 9 Timberwood Rd
- 139 Mohawk Dr
- 25 Lakeview Dr
- 729 Mountain Rd
- 34 Cary Ln Unit 34
- 1 Cedar Close
- 30 Farmstead Ln
- 12 Haviland Rd
- 10 Hosmer Dr
- 2581 Albany Ave
- 2 Chambord Park