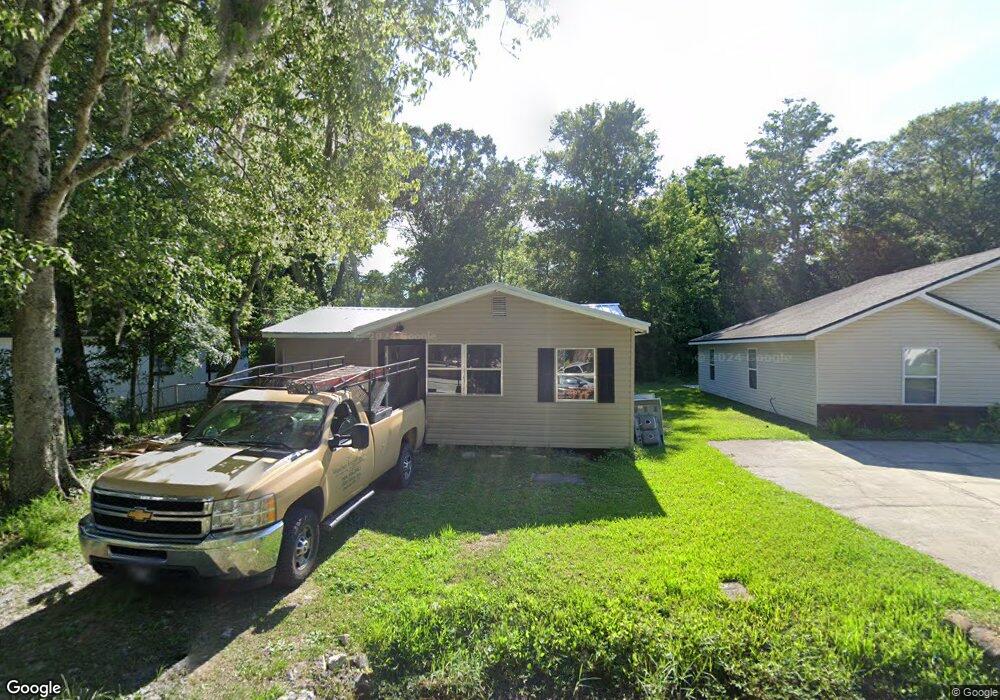
1266 Neva St Jacksonville, FL 32205
Hillcrest NeighborhoodEstimated Value: $120,000 - $164,000
3
Beds
1
Bath
795
Sq Ft
$181/Sq Ft
Est. Value
About This Home
This home is located at 1266 Neva St, Jacksonville, FL 32205 and is currently estimated at $143,514, approximately $180 per square foot. 1266 Neva St is a home located in Duval County with nearby schools including Andros Karperos, Hyde Park Elementary School, and Lake Shore Middle School.
Ownership History
Date
Name
Owned For
Owner Type
Purchase Details
Closed on
Nov 3, 2003
Sold by
Emc Mortgage Corp
Bought by
Toupin Thomas C
Current Estimated Value
Purchase Details
Closed on
Jul 2, 2003
Sold by
Knight Carroll M
Bought by
Emc Mortgage Corp
Purchase Details
Closed on
May 2, 2002
Sold by
Beard Jason R and Beard Kelli R
Bought by
Knight Carroll M
Home Financials for this Owner
Home Financials are based on the most recent Mortgage that was taken out on this home.
Original Mortgage
$53,550
Interest Rate
7.18%
Purchase Details
Closed on
Mar 3, 2000
Sold by
Roark Elizabeth N
Bought by
Beard Jason R and Beard Kelli R
Home Financials for this Owner
Home Financials are based on the most recent Mortgage that was taken out on this home.
Original Mortgage
$22,172
Interest Rate
8.3%
Create a Home Valuation Report for This Property
The Home Valuation Report is an in-depth analysis detailing your home's value as well as a comparison with similar homes in the area
Home Values in the Area
Average Home Value in this Area
Purchase History
| Date | Buyer | Sale Price | Title Company |
|---|---|---|---|
| Toupin Thomas C | $33,000 | Landsafe Title Florida Inc | |
| Emc Mortgage Corp | -- | -- | |
| Knight Carroll M | $63,000 | Attorneys Title Ins Fund Inc | |
| Beard Jason R | $13,000 | -- |
Source: Public Records
Mortgage History
| Date | Status | Borrower | Loan Amount |
|---|---|---|---|
| Previous Owner | Knight Carroll M | $53,550 | |
| Previous Owner | Beard Jason R | $22,172 |
Source: Public Records
Tax History Compared to Growth
Tax History
| Year | Tax Paid | Tax Assessment Tax Assessment Total Assessment is a certain percentage of the fair market value that is determined by local assessors to be the total taxable value of land and additions on the property. | Land | Improvement |
|---|---|---|---|---|
| 2025 | $1,434 | $65,870 | -- | -- |
| 2024 | $1,381 | $88,701 | $49,500 | $39,201 |
| 2023 | $1,381 | $88,859 | $49,500 | $39,359 |
| 2022 | $1,159 | $74,050 | $38,250 | $35,800 |
| 2021 | $1,072 | $62,726 | $33,750 | $28,976 |
| 2020 | $958 | $50,461 | $22,500 | $27,961 |
| 2019 | $893 | $44,814 | $16,875 | $27,939 |
| 2018 | $791 | $33,803 | $7,875 | $25,928 |
| 2017 | $745 | $30,903 | $6,750 | $24,153 |
| 2016 | $705 | $28,314 | $0 | $0 |
| 2015 | $664 | $25,548 | $0 | $0 |
| 2014 | $687 | $26,446 | $0 | $0 |
Source: Public Records
Map
Nearby Homes
- 1249 Pangola Dr
- 1238 Pangola Dr
- 1246 Mull St
- 1242 Mull St
- 5419 Woodcrest Rd
- 1231 Pangola Dr
- 1339 Ellis Rd S
- 1343 Pangola Dr
- 1308 Lake Shore Blvd
- 1207 Neva St
- 1205 Neva St
- 1259 Lake Shore Blvd
- 1302 Cedar Annex Ave
- 1262 Peacefield Dr
- Sandalwood Plan at Park Trace - Seasons
- Rosewood Plan at Park Trace - Seasons
- Sandalwood III Plan at Park Trace - Seasons
- Sandalwood II Plan at Park Trace - Seasons
- 5549 Plymouth St
- 1362 Lake Shore Blvd