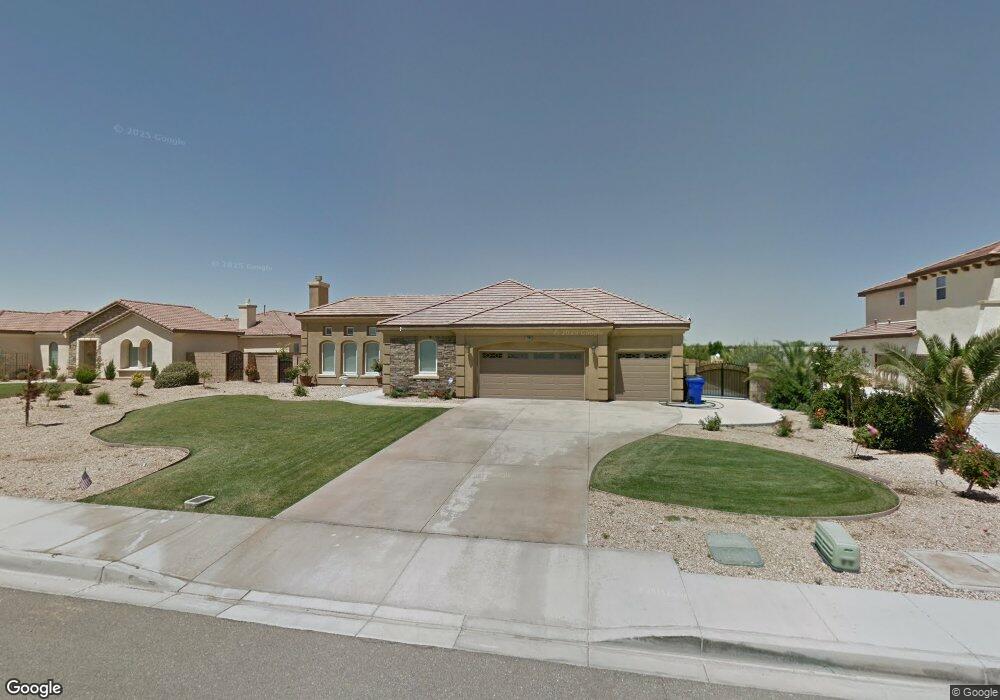
12668 Mar Vista Dr Apple Valley, CA 92308
High Desert NeighborhoodEstimated Value: $626,638 - $783,000
4
Beds
3
Baths
3,188
Sq Ft
$217/Sq Ft
Est. Value
About This Home
This home is located at 12668 Mar Vista Dr, Apple Valley, CA 92308 and is currently estimated at $692,910, approximately $217 per square foot. 12668 Mar Vista Dr is a home located in San Bernardino County with nearby schools including Rio Vista School of Applied Learning, Apple Valley High School, and Excelsior Charter School.
Ownership History
Date
Name
Owned For
Owner Type
Purchase Details
Closed on
Mar 24, 2009
Sold by
American Home Mortgage Servicing Inc
Bought by
Kaboo Randhir and Lopez Deanna M
Current Estimated Value
Home Financials for this Owner
Home Financials are based on the most recent Mortgage that was taken out on this home.
Original Mortgage
$201,000
Outstanding Balance
$125,556
Interest Rate
4.8%
Mortgage Type
Purchase Money Mortgage
Estimated Equity
$567,354
Purchase Details
Closed on
Nov 6, 2008
Sold by
Dod Sonya M and Dod Brian W
Bought by
American Home Mortgage Servicing Inc
Purchase Details
Closed on
May 3, 2006
Sold by
First Pacific Homes Ii Llc
Bought by
Dod Brian W and Dod Sonya M
Home Financials for this Owner
Home Financials are based on the most recent Mortgage that was taken out on this home.
Original Mortgage
$467,524
Interest Rate
2.55%
Mortgage Type
Fannie Mae Freddie Mac
Create a Home Valuation Report for This Property
The Home Valuation Report is an in-depth analysis detailing your home's value as well as a comparison with similar homes in the area
Home Values in the Area
Average Home Value in this Area
Purchase History
| Date | Buyer | Sale Price | Title Company |
|---|---|---|---|
| Kaboo Randhir | $300,000 | Lsi Title Company | |
| American Home Mortgage Servicing Inc | $427,674 | Accommodation | |
| Dod Brian W | $550,500 | First American Title Company |
Source: Public Records
Mortgage History
| Date | Status | Borrower | Loan Amount |
|---|---|---|---|
| Open | Kaboo Randhir | $201,000 | |
| Previous Owner | Dod Brian W | $467,524 |
Source: Public Records
Tax History Compared to Growth
Tax History
| Year | Tax Paid | Tax Assessment Tax Assessment Total Assessment is a certain percentage of the fair market value that is determined by local assessors to be the total taxable value of land and additions on the property. | Land | Improvement |
|---|---|---|---|---|
| 2025 | $4,641 | $386,333 | $64,390 | $321,943 |
| 2024 | $4,641 | $378,757 | $63,127 | $315,630 |
| 2023 | $4,603 | $371,330 | $61,889 | $309,441 |
| 2022 | $4,538 | $364,049 | $60,675 | $303,374 |
| 2021 | $4,441 | $356,910 | $59,485 | $297,425 |
| 2020 | $4,391 | $353,250 | $58,875 | $294,375 |
| 2019 | $4,316 | $346,324 | $57,721 | $288,603 |
| 2018 | $4,217 | $339,533 | $56,589 | $282,944 |
| 2017 | $4,163 | $332,875 | $55,479 | $277,396 |
| 2016 | $4,039 | $326,348 | $54,391 | $271,957 |
| 2015 | $3,985 | $321,446 | $53,574 | $267,872 |
| 2014 | $3,935 | $315,150 | $52,525 | $262,625 |
Source: Public Records
Map
Nearby Homes
- 12682 Mar Vista Dr
- 12720 Yorkshire Dr
- 12809 Yorkshire Dr
- 18995 Appaloosa Rd
- 12395 Yorkshire Dr
- 12360 Reata Rd
- 12916 Hyperion Ln
- 19274 Kanbridge St
- 12982 Topsham Bay
- 0 Bay Meadows Dr
- 12971 Lompoc Rd
- 18935 Caballero Rd
- 19135 Monterey St
- 19220 Monterey St
- 13195 Trailwood Way
- 13055 Riverview Dr
- 12850 Bermuda Dunes Dr
- 13262 Cuyamaca Rd
- 18505 Kalin Ranch Dr
- 12785 Pinehurst Trail
- 12652 Mar Vista Dr
- 12636 Mar Vista Dr
- 12690 Mar Vista Dr
- 12665 Sorrel Dr
- 19134 La Quinta Place
- 12645 Sorrel Dr
- 19135 La Quinta Place
- 12685 Sorrel Dr
- 12635 Sorrel Dr
- 12620 Mar Vista Dr
- 12698 Mar Vista Dr
- 12695 Sorrel Dr
- 19150 La Quinta Place
- 19151 La Quinta Place
- 19129 Catalina Rd
- 12615 Sorrel Dr
- 19136 Saguaro Way
- 12715 Sorrel Dr
- 19149 Catalina Rd
- 12604 Mar Vista Dr