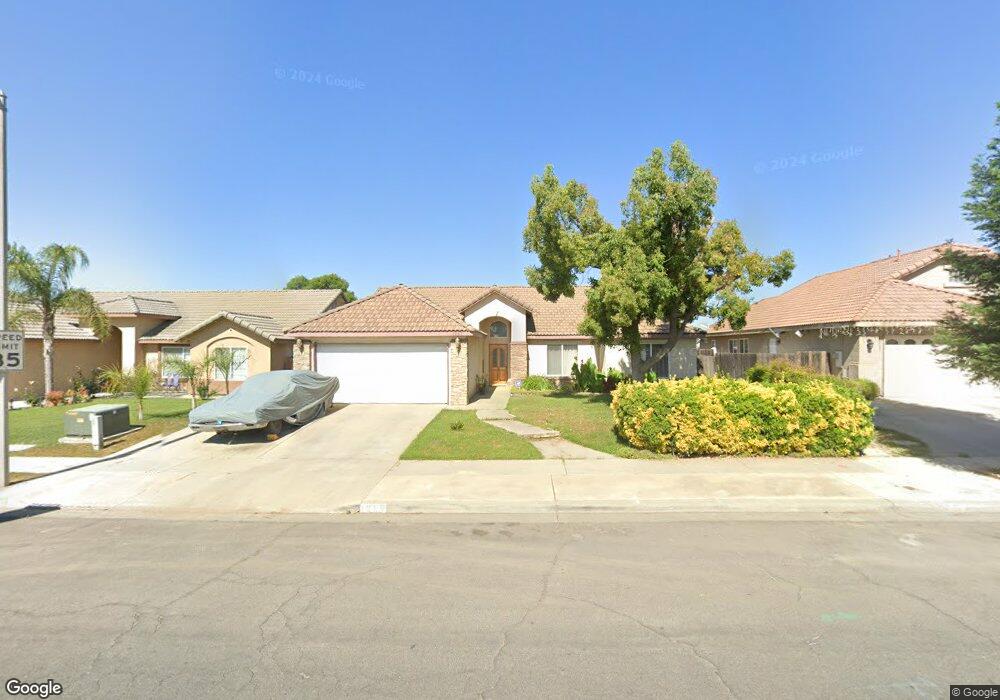
1267 N Sacramento St Tulare, CA 93274
Tulare Northwest NeighborhoodEstimated Value: $347,000 - $361,000
4
Beds
2
Baths
9,999
Sq Ft
$35/Sq Ft
Est. Value
About This Home
This home is located at 1267 N Sacramento St, Tulare, CA 93274 and is currently estimated at $353,872, approximately $35 per square foot. 1267 N Sacramento St is a home located in Tulare County with nearby schools including Heritage Elementary School, Los Tules Middle School, and Tulare Western High School.
Ownership History
Date
Name
Owned For
Owner Type
Purchase Details
Closed on
Aug 13, 2001
Sold by
Hud
Bought by
Ling Eugene and Ling Carolyn L
Current Estimated Value
Home Financials for this Owner
Home Financials are based on the most recent Mortgage that was taken out on this home.
Original Mortgage
$117,420
Outstanding Balance
$45,472
Interest Rate
7.05%
Mortgage Type
VA
Estimated Equity
$308,400
Purchase Details
Closed on
May 1, 2001
Sold by
Countrywide Home Loans
Bought by
Hud
Purchase Details
Closed on
May 8, 2000
Sold by
Pedro Jack
Bought by
Esquivel Beatrice
Purchase Details
Closed on
Aug 5, 1998
Sold by
Palma Construction Inc
Bought by
Pedro Jack and Esquivel Beatriz
Home Financials for this Owner
Home Financials are based on the most recent Mortgage that was taken out on this home.
Original Mortgage
$117,121
Interest Rate
6.73%
Mortgage Type
FHA
Create a Home Valuation Report for This Property
The Home Valuation Report is an in-depth analysis detailing your home's value as well as a comparison with similar homes in the area
Home Values in the Area
Average Home Value in this Area
Purchase History
| Date | Buyer | Sale Price | Title Company |
|---|---|---|---|
| Ling Eugene | $92,500 | Fidelity National Title Co | |
| Hud | -- | -- | |
| Countrywide Home Loans Inc | $125,340 | -- | |
| Esquivel Beatrice | -- | -- | |
| Pedro Jack | $118,000 | Cuesta Title Company |
Source: Public Records
Mortgage History
| Date | Status | Borrower | Loan Amount |
|---|---|---|---|
| Open | Ling Eugene | $117,420 | |
| Previous Owner | Pedro Jack | $117,121 |
Source: Public Records
Tax History Compared to Growth
Tax History
| Year | Tax Paid | Tax Assessment Tax Assessment Total Assessment is a certain percentage of the fair market value that is determined by local assessors to be the total taxable value of land and additions on the property. | Land | Improvement |
|---|---|---|---|---|
| 2025 | $1,410 | $136,653 | $38,410 | $98,243 |
| 2024 | $1,410 | $133,974 | $37,657 | $96,317 |
| 2023 | $1,372 | $131,348 | $36,919 | $94,429 |
| 2022 | $1,331 | $128,774 | $36,196 | $92,578 |
| 2021 | $1,312 | $126,249 | $35,486 | $90,763 |
| 2020 | $1,333 | $124,954 | $35,122 | $89,832 |
| 2019 | $1,365 | $122,504 | $34,433 | $88,071 |
| 2018 | $1,342 | $120,102 | $33,758 | $86,344 |
| 2017 | $1,328 | $117,747 | $33,096 | $84,651 |
| 2016 | $1,268 | $115,438 | $32,447 | $82,991 |
| 2015 | $1,223 | $113,704 | $31,960 | $81,744 |
| 2014 | $1,223 | $111,477 | $31,334 | $80,143 |
Source: Public Records
Map
Nearby Homes
- 1287 Palo Alto St
- 830 Alameda St
- 1721 Cotton Ct
- 1149 N E St
- 1695 Cochran Ave
- 704 Lassen Ave
- 1800 W Merritt Ave
- 770 W Pleasant Ave
- 560 W Pleasant Ave Unit 75
- 560 W Pleasant Ave Unit 26
- 560 W Pleasant Ave Unit 48
- 560 W Pleasant Ave Unit 66
- 560 W Pleasant Ave Unit 51
- 560 W Pleasant Ave Unit 74
- 697 San Diego St
- 1521 W Juliet Ave
- 920 Maricopa St
- 1266 N H St
- 843 N Milner St
- 615 Catalina Cir
- 1255 N Sacramento St
- 1271 N Sacramento St
- 1285 N Sacramento St
- 1221 N Sacramento St
- 1297 N Sacramento St
- 1209 N Sacramento St
- 1180 W Delta Ave
- 1282 N Sacramento St
- 1179 W Delta Ave
- 1170 N Petaluma St
- 1298 N Sacramento St
- 1178 W Delta Ave
- 1162 N Petaluma St
- 0 N Sacramento St
- 1176 N Sacramento St
- 1167 W Delta Ave
- 1164 W Delta Ave
- 1154 N Petaluma St
- 1142 W Prosperity Ave
- 1164 N Sacramento St