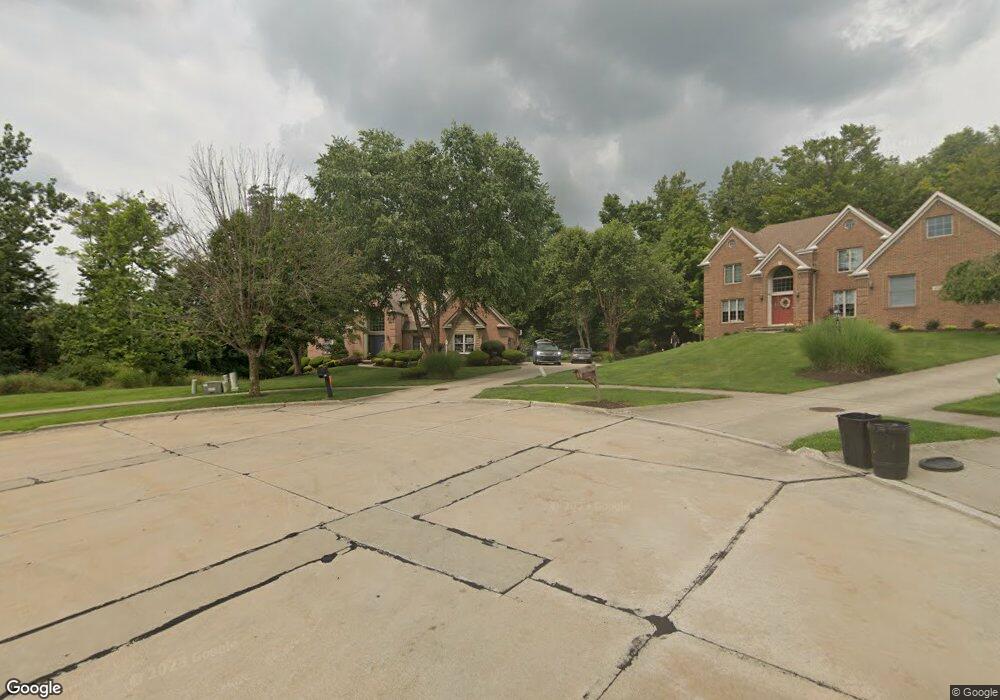
12672 Pioneer Trail Dr North Royalton, OH 44133
Estimated Value: $483,000 - $661,000
4
Beds
5
Baths
3,064
Sq Ft
$189/Sq Ft
Est. Value
About This Home
This home is located at 12672 Pioneer Trail Dr, North Royalton, OH 44133 and is currently estimated at $580,213, approximately $189 per square foot. 12672 Pioneer Trail Dr is a home located in Cuyahoga County with nearby schools including North Royalton Middle School, North Royalton High School, and Saint Albert the Great Roman Catholic School.
Ownership History
Date
Name
Owned For
Owner Type
Purchase Details
Closed on
Feb 19, 2020
Sold by
Nam Kap Soon Oh and Nam Hae Man
Bought by
Nam Kap Soon Oh
Current Estimated Value
Home Financials for this Owner
Home Financials are based on the most recent Mortgage that was taken out on this home.
Original Mortgage
$141,912
Outstanding Balance
$97,543
Interest Rate
3.5%
Mortgage Type
Future Advance Clause Open End Mortgage
Estimated Equity
$482,671
Purchase Details
Closed on
Jul 18, 2011
Sold by
Lemire John A and Lemire Karen T
Bought by
Nam Kap Soon Oh and Pudner Heejung Jin
Home Financials for this Owner
Home Financials are based on the most recent Mortgage that was taken out on this home.
Original Mortgage
$252,500
Interest Rate
4.25%
Mortgage Type
FHA
Purchase Details
Closed on
May 30, 2003
Sold by
J Friedrich Construction Co
Bought by
Lemire John A and Lemire Karen T
Create a Home Valuation Report for This Property
The Home Valuation Report is an in-depth analysis detailing your home's value as well as a comparison with similar homes in the area
Home Values in the Area
Average Home Value in this Area
Purchase History
| Date | Buyer | Sale Price | Title Company |
|---|---|---|---|
| Nam Kap Soon Oh | -- | Fidelity National Ttl Ins Co | |
| Nam Kap Soon Oh | $330,000 | Attorney | |
| Lemire John A | $350,000 | Chicago Title Insurance Co |
Source: Public Records
Mortgage History
| Date | Status | Borrower | Loan Amount |
|---|---|---|---|
| Open | Nam Kap Soon Oh | $141,912 | |
| Previous Owner | Nam Kap Soon Oh | $252,500 |
Source: Public Records
Tax History Compared to Growth
Tax History
| Year | Tax Paid | Tax Assessment Tax Assessment Total Assessment is a certain percentage of the fair market value that is determined by local assessors to be the total taxable value of land and additions on the property. | Land | Improvement |
|---|---|---|---|---|
| 2024 | $9,883 | $170,135 | $34,265 | $135,870 |
| 2023 | $8,523 | $134,580 | $31,680 | $102,900 |
| 2022 | $8,466 | $134,575 | $31,675 | $102,900 |
| 2021 | $8,555 | $134,580 | $31,680 | $102,900 |
| 2020 | $8,572 | $128,170 | $30,170 | $98,000 |
| 2019 | $8,322 | $366,200 | $86,200 | $280,000 |
| 2018 | $8,410 | $128,170 | $30,170 | $98,000 |
| 2017 | $8,131 | $118,340 | $27,650 | $90,690 |
| 2016 | $7,619 | $118,340 | $27,650 | $90,690 |
| 2015 | $6,981 | $118,340 | $27,650 | $90,690 |
| 2014 | $6,981 | $107,590 | $25,130 | $82,460 |
Source: Public Records
Map
Nearby Homes
- 12701 Gordon St
- 12906 Cartwright Pkwy
- 13000 Cartwright Pkwy
- 7554 Margaret Dr
- 7595 Margaret Dr
- 7545 Margaret Dr
- 7585 Margaret Dr
- 7575 Margaret Dr
- 7535 Margaret Dr
- 7555 Margaret Dr
- 7600 Margaret Dr
- 7564 Margaret Dr
- 7574 Margaret Dr
- S/L Margaret Dr
- 9035 Wallings Rd
- 13831 Woodcroft Trace
- 11550 York Rd
- 9611 Sunrise Blvd Unit K2
- 7332 Creekwood Dr Unit 4B
- 9530 Cove Dr Unit C-25
- 12675 Pioneer Trail Dr
- 12692 Pioneer Trail Dr
- 12687 Ponderosa Dr
- 12685 Pioneer Trail Dr
- 12695 Pioneer Trail Dr
- 12677 Ponderosa Dr
- 12702 Pioneer Trail Dr
- 12705 Pioneer Trail Dr
- 12668 Tall Timber Cir
- Ponderosa Dr
- 12697 Ponderosa Dr
- 12674 Ponderosa Dr
- 12660 Tall Timber Cir
- 12677 Tall Timber Cir
- 7598 Harley Hills Dr
- 7588 Harley Hills Dr
- 7618 Harley Hills Dr
- 7578 Harley Hills Dr
- 0 Ponderosa Dr
- 7638 Harley Hills Dr