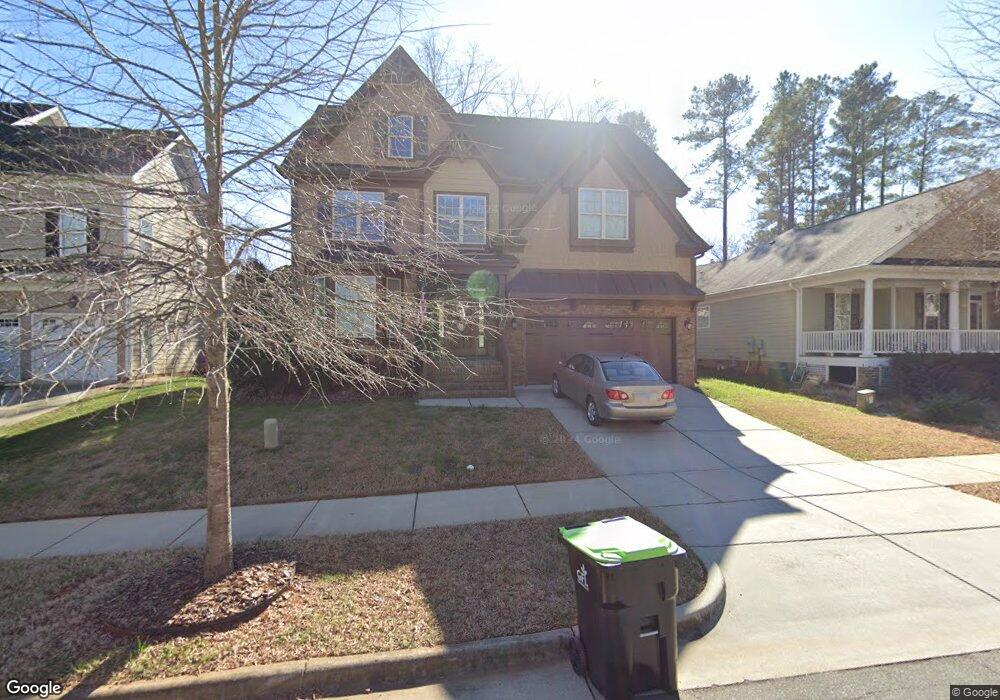
127 Cobble Ridge Dr Unit 74 Pittsboro, NC 27312
Estimated Value: $442,000 - $516,000
3
Beds
3
Baths
2,436
Sq Ft
$198/Sq Ft
Est. Value
About This Home
This home is located at 127 Cobble Ridge Dr Unit 74, Pittsboro, NC 27312 and is currently estimated at $481,765, approximately $197 per square foot. 127 Cobble Ridge Dr Unit 74 is a home located in Chatham County with nearby schools including Pittsboro Elementary School, George Moses Horton Middle School, and Northwood High.
Ownership History
Date
Name
Owned For
Owner Type
Purchase Details
Closed on
Aug 7, 2023
Sold by
Holcomb Howard Joseph and Holcomb Brittany Reed
Bought by
Hovig Samuel and Hovig Mary
Current Estimated Value
Home Financials for this Owner
Home Financials are based on the most recent Mortgage that was taken out on this home.
Original Mortgage
$339,187
Outstanding Balance
$330,914
Interest Rate
6.67%
Mortgage Type
VA
Estimated Equity
$150,851
Purchase Details
Closed on
Sep 30, 2019
Sold by
Hanna Jane R and Hanna Johnny F
Bought by
Holcomb Howard Joseph and Holcomb Brittany Reed
Purchase Details
Closed on
Mar 22, 2013
Sold by
Phil Stone Homes Inc
Bought by
Hanna Jane R and Hanna Johnny F
Purchase Details
Closed on
Jun 15, 2012
Sold by
Pnc Bank National Association
Bought by
Phil Stone Homes Inc
Purchase Details
Closed on
May 12, 2011
Sold by
Builder Resource & Development Co L P
Bought by
Rbc Bank Usa
Create a Home Valuation Report for This Property
The Home Valuation Report is an in-depth analysis detailing your home's value as well as a comparison with similar homes in the area
Home Values in the Area
Average Home Value in this Area
Purchase History
| Date | Buyer | Sale Price | Title Company |
|---|---|---|---|
| Hovig Samuel | $485,000 | None Listed On Document | |
| Holcomb Howard Joseph | $315,000 | None Available | |
| Hanna Jane R | $247,000 | None Available | |
| Phil Stone Homes Inc | $139,000 | None Available | |
| Rbc Bank Usa | $23,727 | None Available |
Source: Public Records
Mortgage History
| Date | Status | Borrower | Loan Amount |
|---|---|---|---|
| Open | Hovig Samuel | $339,187 |
Source: Public Records
Tax History Compared to Growth
Tax History
| Year | Tax Paid | Tax Assessment Tax Assessment Total Assessment is a certain percentage of the fair market value that is determined by local assessors to be the total taxable value of land and additions on the property. | Land | Improvement |
|---|---|---|---|---|
| 2025 | $5,117 | $468,433 | $67,850 | $400,583 |
| 2024 | $5,117 | $289,144 | $59,000 | $230,144 |
| 2023 | $3,604 | $289,144 | $59,000 | $230,144 |
| 2022 | $3,405 | $289,144 | $59,000 | $230,144 |
| 2021 | $0 | $289,144 | $59,000 | $230,144 |
| 2020 | $3,177 | $270,284 | $50,000 | $220,284 |
| 2019 | $3,167 | $270,284 | $50,000 | $220,284 |
| 2018 | $3,034 | $270,284 | $50,000 | $220,284 |
| 2017 | $3,034 | $270,284 | $50,000 | $220,284 |
| 2016 | $3,025 | $268,036 | $50,000 | $218,036 |
| 2015 | $2,993 | $268,036 | $50,000 | $218,036 |
| 2014 | $2,993 | $268,036 | $50,000 | $218,036 |
| 2013 | -- | $57,500 | $45,000 | $12,500 |
Source: Public Records
Map
Nearby Homes
- 73 Freeman Dr
- 26 Danbury Ct
- 115 Circle City Way
- CHANLEY Plan at Corbett Landing
- CHAMPLAIN Plan at Corbett Landing
- ELMSDALE Plan at Corbett Landing
- SEBASTIAN Plan at Corbett Landing
- DRESDEN Plan at Corbett Landing
- BALLENTINE Plan at Corbett Landing
- PARKETTE Plan at Corbett Landing
- MARABELLE Plan at Corbett Landing
- KENDALL Plan at Corbett Landing
- THEODORE Plan at Corbett Landing
- BRANFORD Plan at Corbett Landing
- KAITLYN Plan at Corbett Landing
- 289 Gaines Trail
- 63 Loggers
- Shelby Modern Farmhouse Plan at Corbett Landing
- Chatham Forest English Cottage Plan at Corbett Landing
- Hamilton Craftsman Plan at Corbett Landing
- 127 Cobble Ridge Dr
- 143 Cobble Ridge Dr
- 109 Cobble Ridge Dr
- 53 Dunmore Ln
- 74 Wickham Dr
- 128 Cobble Ridge Dr
- 144 Cobble Ridge Dr Unit 200
- 110 Cobble Ridge Dr
- 58 Wickham Dr
- 41 Dunmore Ln
- 148 Cobble Ridge Dr
- 148 Cobble Ridge Dr Unit 203
- 62 Dunmore Ln
- 100 Cobble Ridge Dr
- 48 Dunmore Ln
- 46 Wickham Dr
- 156 Cobble Ridge Dr
- 90 Cobble Ridge Dr
- 44 Dunmore Ln
- 67 Wickham Dr